Polygon price analysis shows the market opened the daily trading session trading at lows of $0.6147 and currently trading at highs of$0.6685. The market has been on a bullish run as it looks to continue its uptrend. Resistance for the coin is present at the $0.67 level while support is at the $0.6147 level. The market is facing some buying action at the moment as the buying pressure is pushing prices higher. The market looks to be in a good uptrend as it has been on a consistent run for the past few days. The market is expected to continue its bullish trend in the near future.
Polygon price analysis shows that the coin is currently trading at $0.6685, up by 3.06 percent.The total trading volume for MATIC/USD pair is $623,355,032.67 while the total market capitalization is $5,228,868,547.56.The market dominance for MATIC price is 0.41 percent as it ranks position 17. The bulls are likely to gain control of the market as the MACD shows a bullish crossover.
MATIC/USD 1-day price analysis: Bullish pattern continues
The one-day chart for MATIC price shows a strong uptrend in the market. The market opened the day trading at lows of $0.6147 and currently trading at highs of $0.6685. The market is on a consistent run for the past few days as it looks to continue its bullish trend in the market. The MACD indicator shows a bullish crossover as the market looks to continue its uptrend.
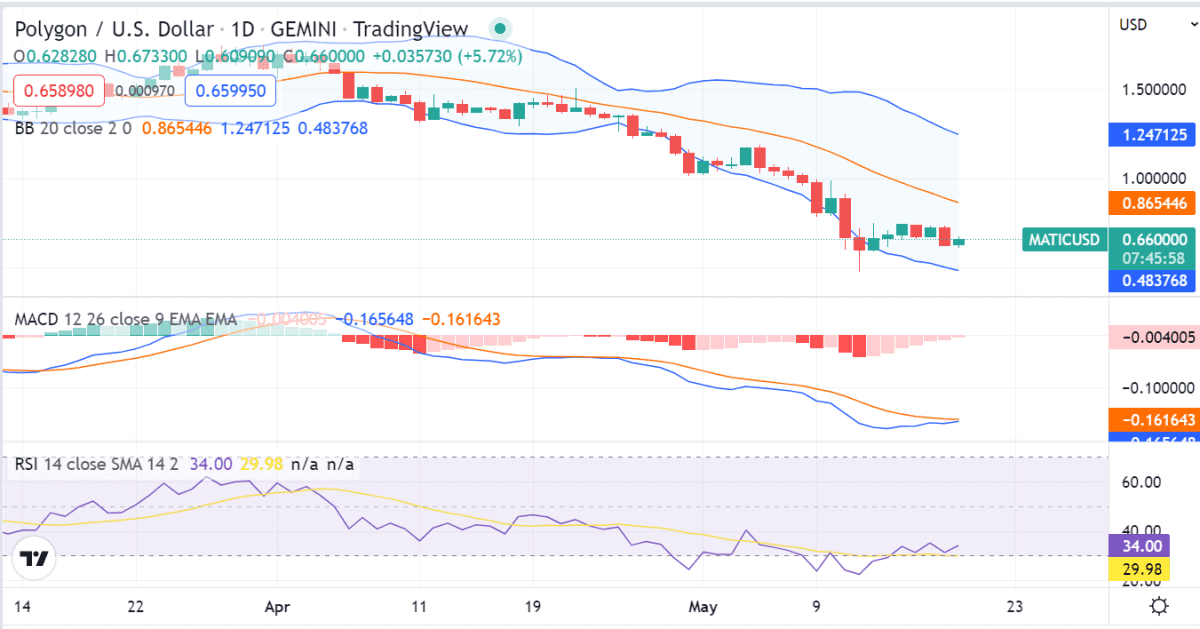
The RSI indicator is currently trading at 68.20, which indicates that the market is currently in the overbought region. However, the market looks to have some space to move higher as it looks to continue its uptrend. The market volatility is currently high as there is some buying pressure in the market as indicated by the bulging Bollinger bands.
MATIC/USD 4-hour price analysis: Uptrend continues as the market hits $0.67
The 4-hour Polygon price analysis shows a strong uptrend in the market. The market opened the day trading at lows of $0.6147 and currently trading at highs of $0.6685.The market is on a consistent run for the past few days as it looks to continue its bullish trend in the market. The MACD indicator shows a bullish crossover as the market looks to continue its uptrend.
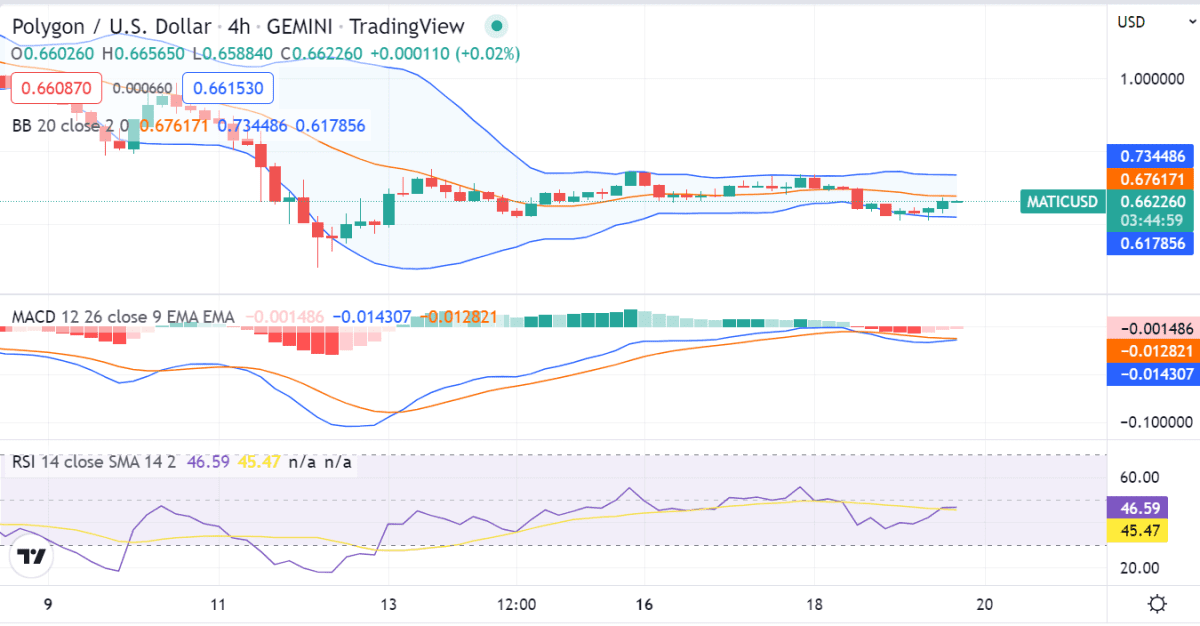
The RSI line is on the move upwards as it looks to enter the overbought region. The market volatility is currently high as there is some buying pressure in the market as indicated by the bulging Bollinger bands. The market looks to be in a good uptrend as it has been on a consistent run for the past few days. The market is expected to continue its bullish trend in the near future.
Polygon price analysis conclusion
Polygon price analysis shows that the market is in a strong uptrend as it looks to continue its bullish run. The market is expected to continue its uptrend in the near future as the MACD indicator shows a bullish crossover. The buying action is expected to continue in the market as the RSI indicator is currently in the overbought region. The market is expected to continue its uptrend as the bulls look to take control of the market.
Disclaimer. The information provided is not trading advice. Cryptopolitan.com holds no liability for any investments made based on the information provided on this page. We strongly recommend independent research and/or consultation with a qualified professional before making any investment decisions.