
$DASH prices fail to sustain the bullish momentum resulting in an increased chance of a downtrend. Should you consider selling right now? Key technical points:
- $DASH prices struggle to sustain above $50.
- The RSI values showcase a bullish divergence.
- The 24-hour trading volume of Dash is $136 Million.
Past Performance of $DASH
$DASH prices have maintained a falling trend since the start of April, resulting in a downfall of more than 60%. The descent breaches all the crucial EMAs and the psychological mark of $100 before taking support at $40. The increased buying pressure at the support level carries a positive reversal to retest the $60 mark. 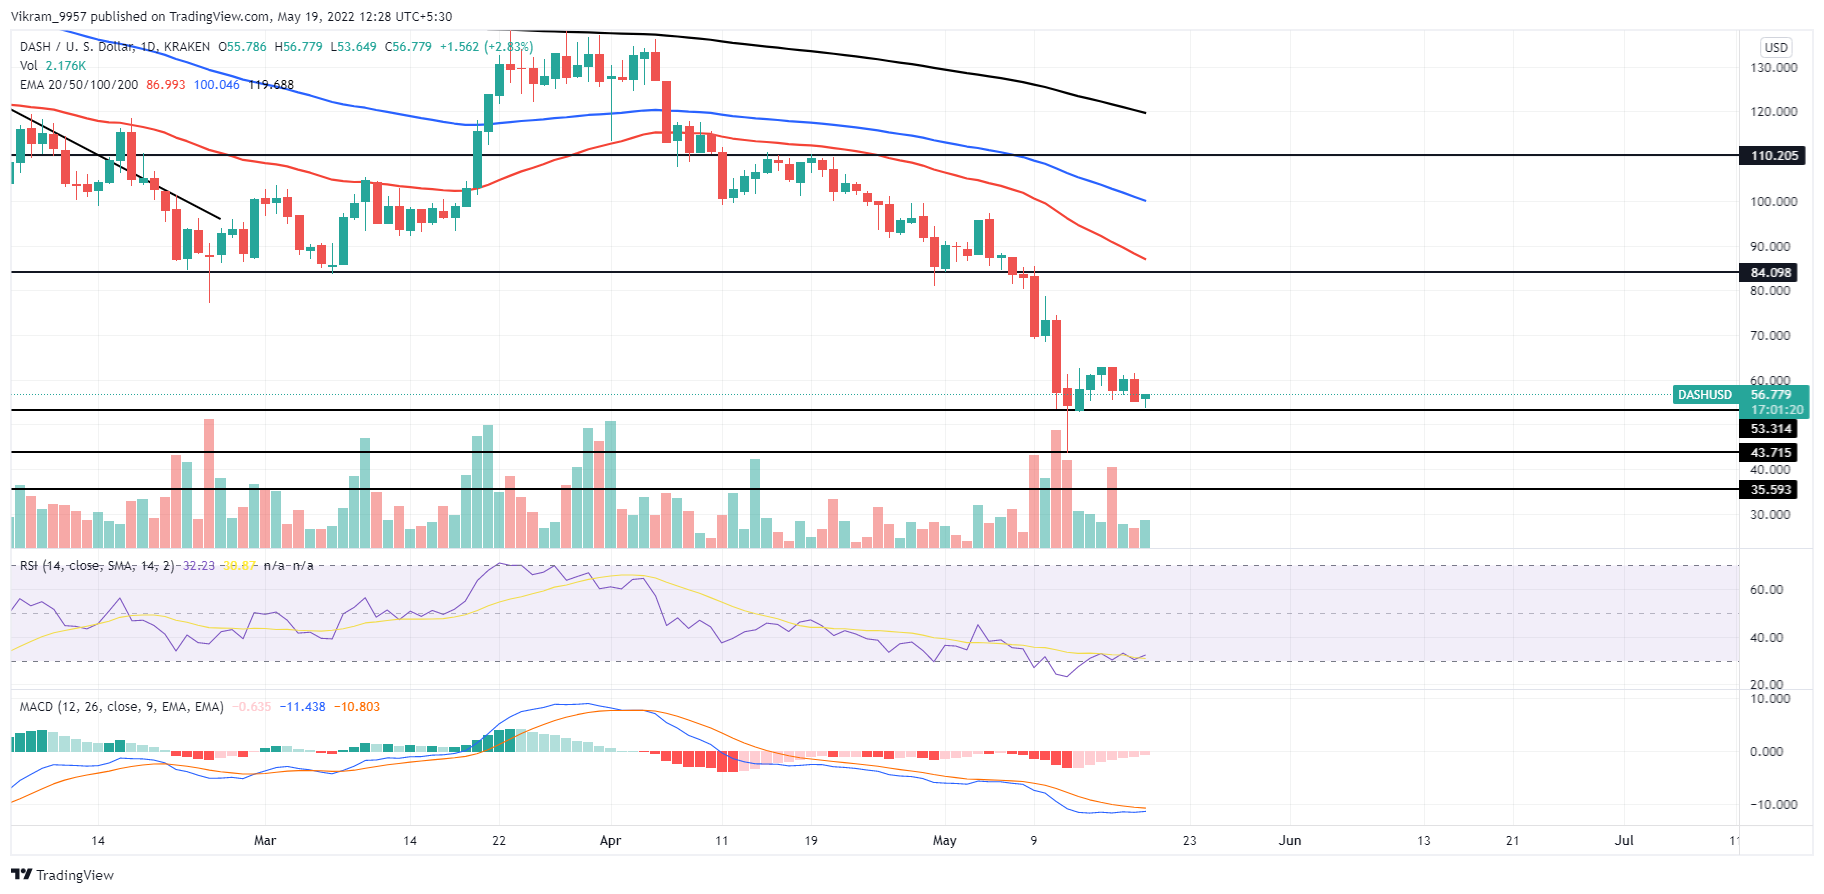 Source-Tradingview
$DASH Technical Analysis
The reversal in $DASH prices to the $60 level fails to sustain the increased buying pressure resulting in a revert to the psychological level of $50. Moreover, the increased selling pressure teases a potential fall under the barrier to reach the next support at $43. The downfall started after the failure to sustain above the $100 mark, avoided the bullish crossover, and restarted the falling trend in a bearish alignment. With the 14-day SMA acting as dynamic resistance, the RSI value continues to decline and takes a dip in the oversold zone. But the recent reversal has brought an attempt to test the average line above the oversold line. It is believed that the MACD, as well as the signal line, are bound by only a few positive backtracking results in a decrease in the spread of bearish. Thus, the probability of a bullish crossover increases as investors anticipate an upcoming upward trend in positive histograms. In short, the $DASH technical analysis depicts an increase in selling pressure ready to break $50.
Upcoming Trend
Currently, the $DASH prices showcase a Doji candle forming above the $50 support level, but the increased selling pressure reflects a high probability of a downtrend. Hence, traders can expect a selling opportunity below $50 with a target of $43. Support Levels: $50 and $43 Resistance Levels: $60 and $85