
Filecoin price analysis indicates a strong bearish movement for FIL prices as bears increase their grip on the market. Prices have set support at the $6.5 level and currently trading around $7.63, down by 30.13 percent in the last 24 hours. The market is expected to remain bearish in the near term as selling pressure continues to mount on the prices. The decline in Filecoin prices is attributed to the general market sell-off as Bitcoin prices also tumbled below the $30000 mark.
The overall market sentiment is bearish as investors remain cautious about the current economic conditions. The general overview of the Filecoin market has seen the trading volume for FIL prices decline, which is now at $993,564,183.99 as the digital asset moved in a range of $6.74 to $11.0 in the last 24 hours. The digital asset is ranked in position 38 overall as it dominates 0.13 of the entire cryptocurrency market.
Filecoin price analysis: Technical analysis
Filecoin price analysis reveals the prices are in a declining trendline as bears eye a move towards the $5.0 support level. The market is facing a general decline as the prices are trading just below the moving average, The 50-day moving average currently stands at $7.78, and the 200-day moving average is at $8.50.
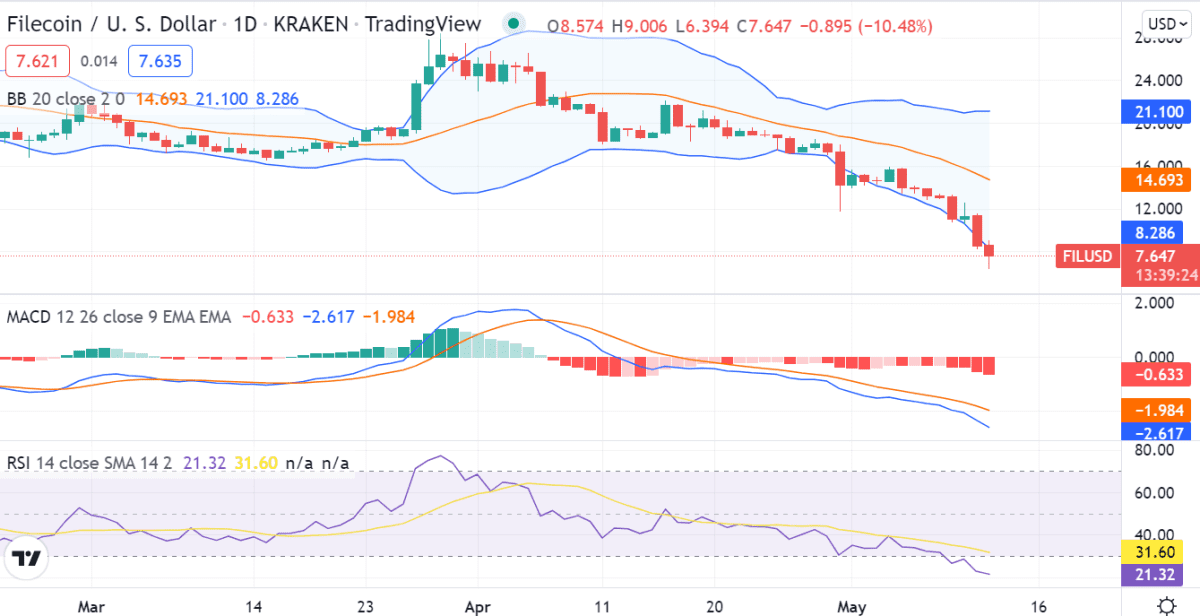
The indicators are currently pointing to a bearish market as the Relative Strength Index (RSI) has dipped below the 50 level, which is an indication that prices may continue to decline in the near term. The MACD indicator has crossed the red signal line from below, indicating a strong bearish market for FIL prices. The current selling action is seen on the Filecoin token, and so the market volatility is high as indicated by the widening Bollinger bands.
FIL/USD 4-hour price analysis: Filecoin prices continue to decline
The 4-hour chart for FIL/USD shows a bearish market as the prices move in a downward trend. The digital asset is trading below the moving averages as selling pressure increases on the prices. The 50-day moving average stands at $8.06, while the 200-day moving average is located at $8.75.
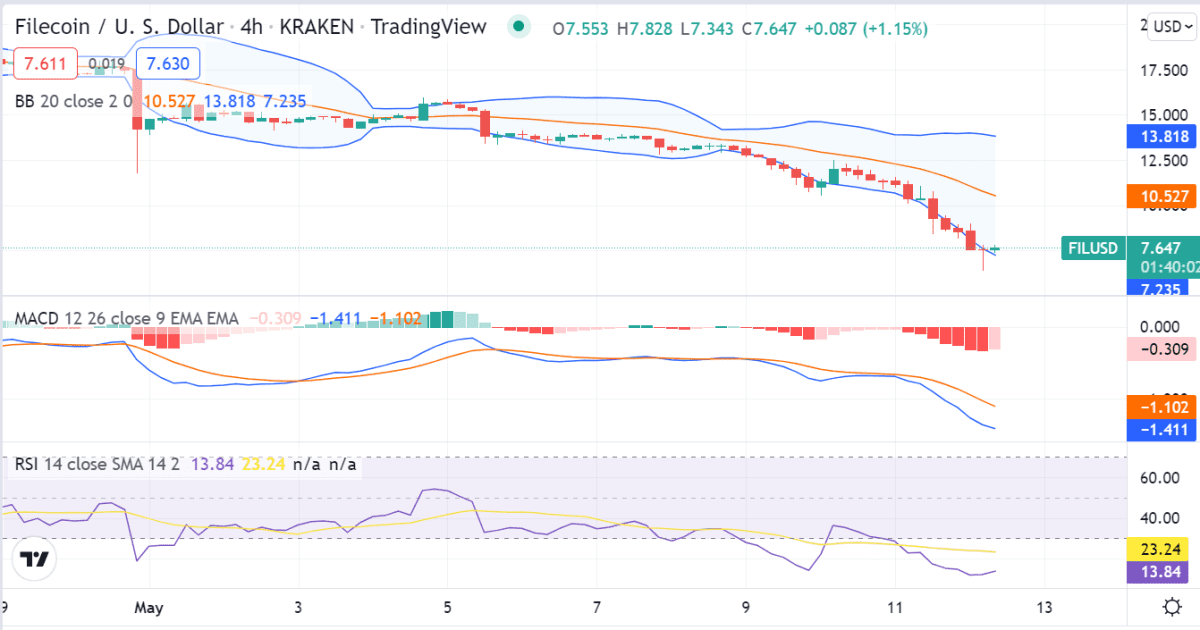
The indicators currently point to a bearish market as the RSI is below the 50 level, which is an indication that prices may continue to decline in the near term. The MACD has crossed the red signal line from below, which is a strong bearish indicator for FIL prices. The Bollinger bands are also widening, which is an indication of high market volatility.
Filecoin price analysis conclusion
Filecoin price analysis reveals that the digital asset is currently in a bearish trend as prices continue to decline. The market is expected to remain bearish in the near term as selling pressure continues to mount on the prices. The indicators are currently pointing to a bearish market as the RSI and MACD have both crossed their respective signal lines from below. The Bollinger bands have also narrowed, which is an indication of low market volatility.
Disclaimer. The information provided is not trading advice. Cryptopolitan.com holds no liability for any investments made based on the information provided on this page. We strongly recommend independent research and/or consultation with a qualified professional before making any investment decisions.