OMG Network is a blockchain network that allows you to build decentralized applications on the Ethereum blockchain. This open-source protocol facilitates financial inclusion and interoperability. It scales Ethereum plasma, rollups, and fast exits. OMG is the native token of this ecosystem and the technical analysis is as follows:
Past Performance
On May 5, 2021, OMG started trading at $8.70. As of May 11, 2021, OMG closed at $12.31. Thus, in the past week, the OMG price has soared by approximately 41%. In the last 24 hours, OMG has traded between $11.78-$12.35.
https://s3.tradingview.com/snapshots/d/DvwVzaFT.png
Day-Ahead and Tomorrow
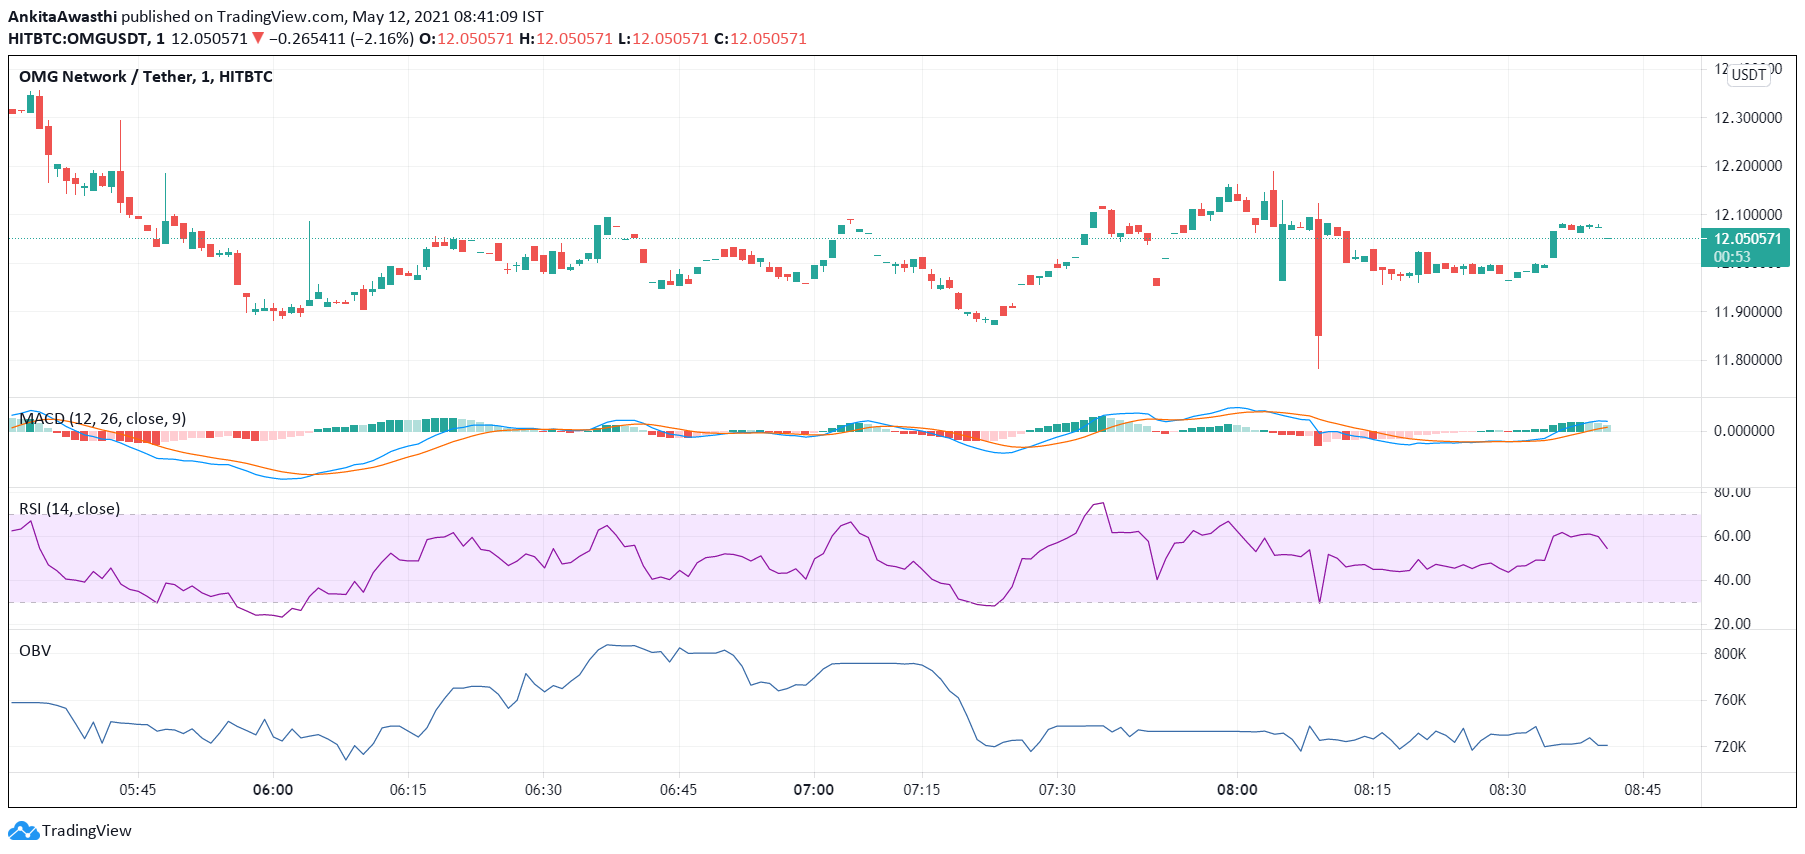
Currently, OMG is trading at $12.05. It has decreased from the day’s opening price of $12.31. Thus, the market seems to be downtick.
The MACD and signal lines have turned positive. Moreover, a bullish crossover by the MACD line over the signal line has occurred. Thus, the overall market momentum is positive. Hence, we can expect the price to start rising soon.
Currently, the RSI indicator is at 57%. It faced rejection at 53% and rose to this level. Thus, buying pressures are increasing. Hence, like the MACD indicator, the RSI oscillator is also pointing towards a price rise.
However, the OBV indicator has fallen steeply. Thus, selling volumes are much higher than buying volumes. Heavy selling activity will exert downward pressure on the OMG price.
OMG Technical Analysis
In short, when we look at all the oscillators together, we can say that the price may continue to fall for some time and thereafter start rising.
Currently, the price is below the Fibonacci pivot point of $12.15. We have to wait and watch to see if the price surpasses the pivot point in some time.
Presently, the price has tested and fallen below the 50% FIB retracement level of $12.06. It may soon test and fall below the 61.8% and 76.4% FIB retracement levels of $12 and $11.91, respectively. Thus, as of now, the bears seem strong. We have to wait and watch if the price retests and breaks out of these levels by day end. If it does so, then the bullish trend is strong and will continue tomorrow as well.