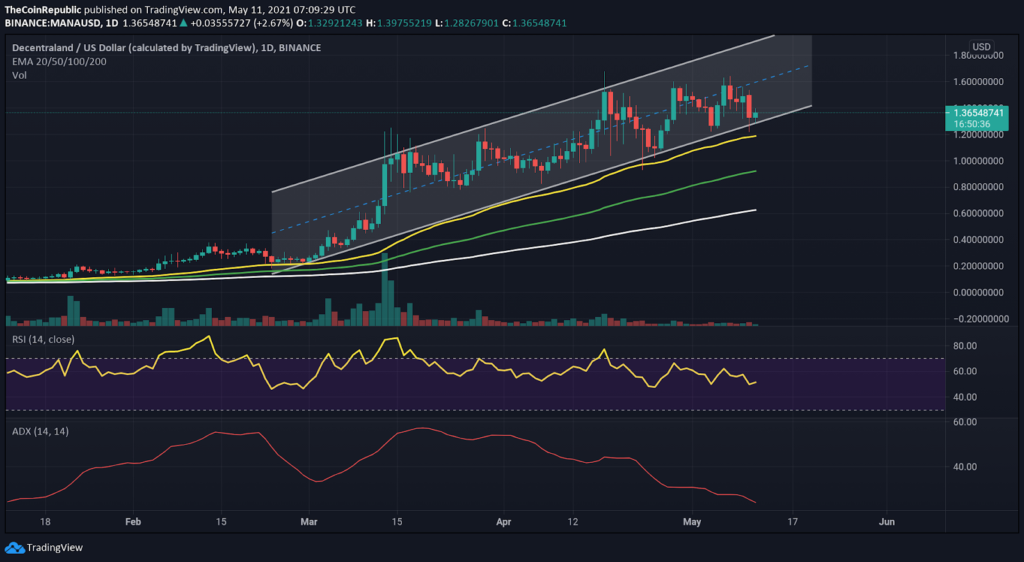
- MANA token price continues to rise inside the parallel channel in the daily timeframe.
- The coin price is trading above all major EMAs with a bullish setup in the weekly timeframe.
- The MANA/BTC pair is trading at 0.00002457, an intraday up move of 2.49%

MANA token price boosted more than 95% by rising higher, inside the parallel channel, in the daily timeframe. The coin price recently started forming lower highs, indicating weakness in the underlying bullish sentiment in the daily picture. However, the coin price still has the possibility of a new higher high in the weekly timeframe. Investors may find this as a positive point for MANA. The live MANA price today is $1.37 with a 24-hour trading volume of $313,639,949. It is down 7.63% in the last 24 hours. As per the market cap, the current ranking of the coin is #65, with a live market cap of $2,157,321,297.
Ascending triangle coiling MANA to hit the $2 mark

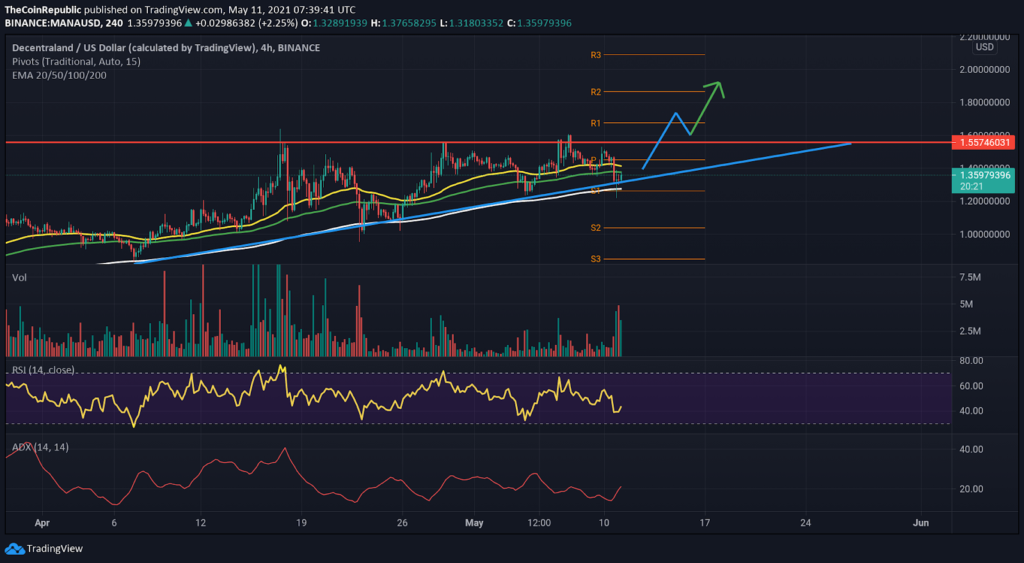
In the daily timeframe, MANA token price has been trending higher by making new higher highs and trading above the major 50 EMA. Along with the bullish parallel channel, the coin price is forming an ascending triangle in the 4-hour timeframe. The support trendline moving close with the 200 EMA is intact and has pushed the price back up for quite some time now. MANA coin price has been facing resistance from the $1.57 level as it is now rising as an important immediate resistance level. Still, a break out of this resistance level might boost the price another 30-35% up after retest and might also hit the $2 mark. The levels of $1.32 and $1 are the immediate support level, as per the pivot points.
In the 4-hour timeframe, the coin price is trading just above the 200 (white) EMA, which indicates an uptrend, but the increasing proximity of the 50(yellow) and 100(green) EMA forecast the possibility of a bearish crossover.
The RSI (bearish) indicates bearish momentum in the 4-hour timeframe while trading at 43. The RSI line is dipped and is making lower highs. It is heading back from the overbought zone, and bearishness can be expected from RSI until it reaches near 35.
The ADX indicates a strong trend momentum, while it is trading at 22.5, and the spike in ADX is rising higher.
Conclusion – MANA token price might break soon out of the ascending triangle, resulting in a new and fresh bull run. Investors may find this as a great opportunity to ride the trend after the proper retest. The sudden eruption of buying pressure in the weekly timeframe also adds points for the bullish trend.
Support- $1.32 and $1
Resistance-$1.57 and $2
 thecoinrepublic.com