The most recent Cardano price analysis shows a decrease in price for the third consecutive day as well, as the bears have continued their lead on the price charts. Red candlesticks have reappeared on the price chart, and the price has reached the $0.780 level after continuous degradation since 5 May 2022. The bullish momentum touched its peak on 4 May 2022, but later on, the bears were able to bring the price down again.
ADA/USD 1-day price chart: ADA price levels decrease after the today’s price action
The 1-day Cardano price analysis indicates a bearish trend for the day as the price has decreased down to the $0.780 level today. The bearish activity has been intensifying for the third consecutive day; however, the downwards oscillation of the price has slowed down a bit, but the coin is at a loss of 2.99 percent in value if observed over the past week. The moving average (MA) value in the 1-day price chart is also trading at $0.794 above the price level.
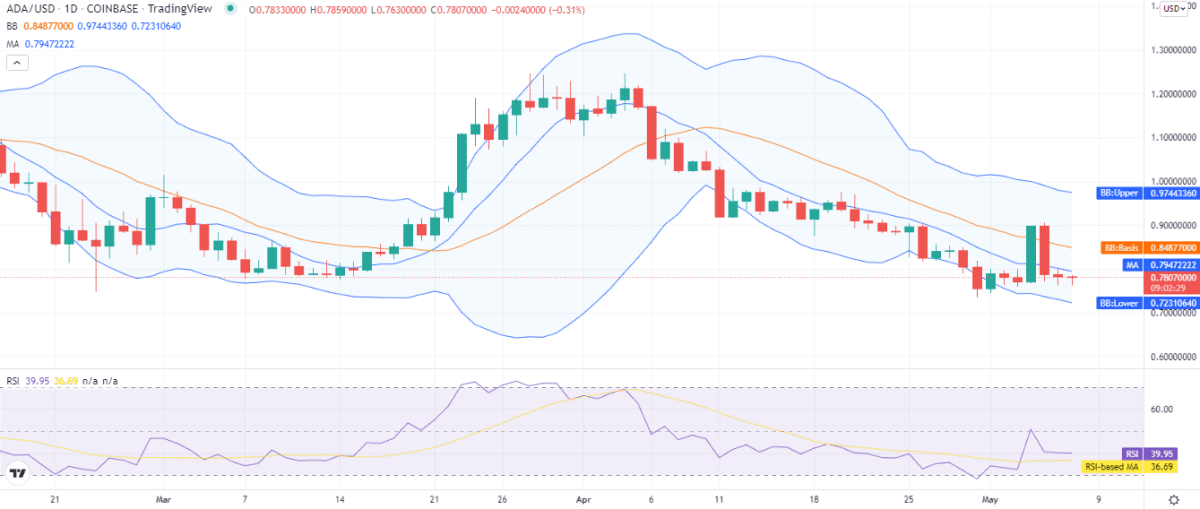
The volatility is high for ADA/USD pair, as the upper limit of the Bollinger bands is at the $0.974 mark, while the lower band is present at the $0.723 mark. The Relative Strength Index (RSI) is trading at index 39 on an almost horizontal curve, hinting at the mixed market sentiment for ADA.
Cardano price analysis: Recent developments and further technical indications
The 4-hours Cardano price analysis confirms that a downtrend has been taking place for the past few hours, as the price trend line is also slightly downwards. There have been instances where the bulls have encountered bearish resistance, but nonetheless, the downward trend has been maintained. The price has been trading below the moving average (MA) value as well, which is present at $0.781. At the same time, the Bollinger bands average is at $0.811 at the time of writing.
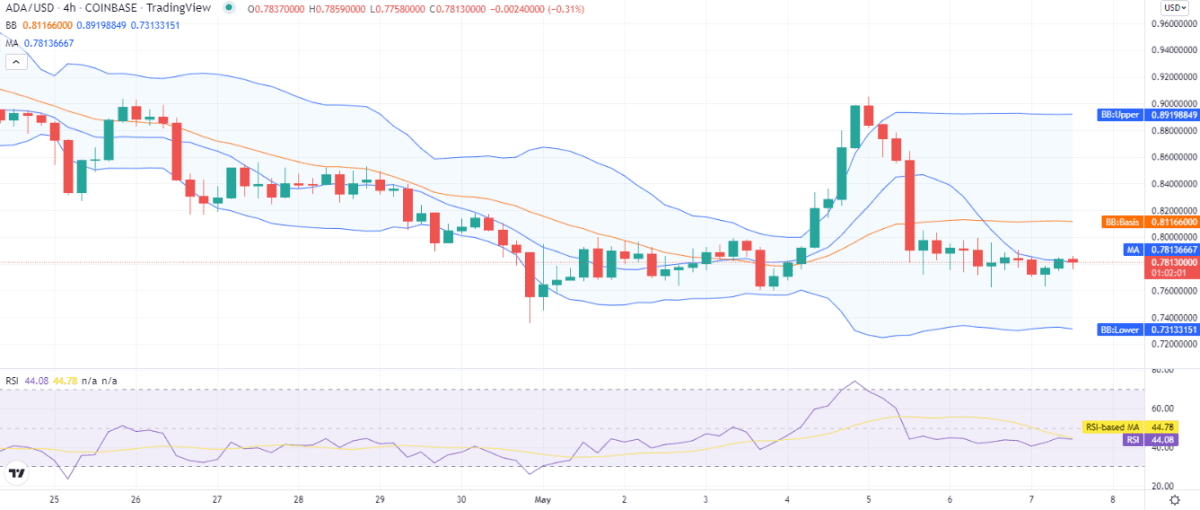
The volatility has been constantly on the high as the Bollinger bands maintain a vast distance for the past 56 hours, and now the upper band is present at $0.891, and the lower band is present at $0.731. The RSI score has started to decrease again in the lower half of the neutral zone and is trading at index 44 as the selling activity resumed again.
Due to the overall trend line for the price function having been downwards for a long time, the technical indicators for ADA/USD pair are also bearish, as 15 indicators are giving sell signals, and only one indicator is giving a buy signal, the remaining 10 technical indicators stand neutral out of a total of 26 technical indicators.
Cardano price analysis conclusion
The Cardano price analysis shows the downtrend has been going strong since 5 May 2022, and even today, a decrease in price has been detected. The bearish momentum has taken the price down to the $0.780 level after the latest downtrend. If the bearish momentum continues, then the ADA price may degrade further in the coming hours.
Disclaimer. The information provided is not trading advice. Cryptopolitan.com holds no liability for any investments made based on the information provided on this page. We strongly recommend independent research and/or consultation with a qualified professional before making any investment decisions.