Avalanche price analysis shows bearish price action after the elongated bearish slide. Bears are covering a downwards range today, which has further deteriorated the circumstances for the token. The bears have been quite aggressive for the past two days, but today, the downfall has slowed down as the decrease in price is small, and the token price has reached a $56.5 low. The price function was headed upwards at the start of the week, but later on, bears made an impactful comeback and have been ruling the market since 5 May 2022.
AVAX/USD 1-day price chart: Price continues sinking for the third day
The one-day Avalanche price analysis shows that the bearish momentum has continued in the past 24-hours. Although the cryptocurrency faced loss in the past few days, the bulls still stand helpless, and the price levels continue sinking. The price is now settling at the $56.5 mark at the time of writing, after the latest decrease. The trading volume has also decreased by 55.22 percent over the last day, which has resulted in market dominance of 0.93 percent.
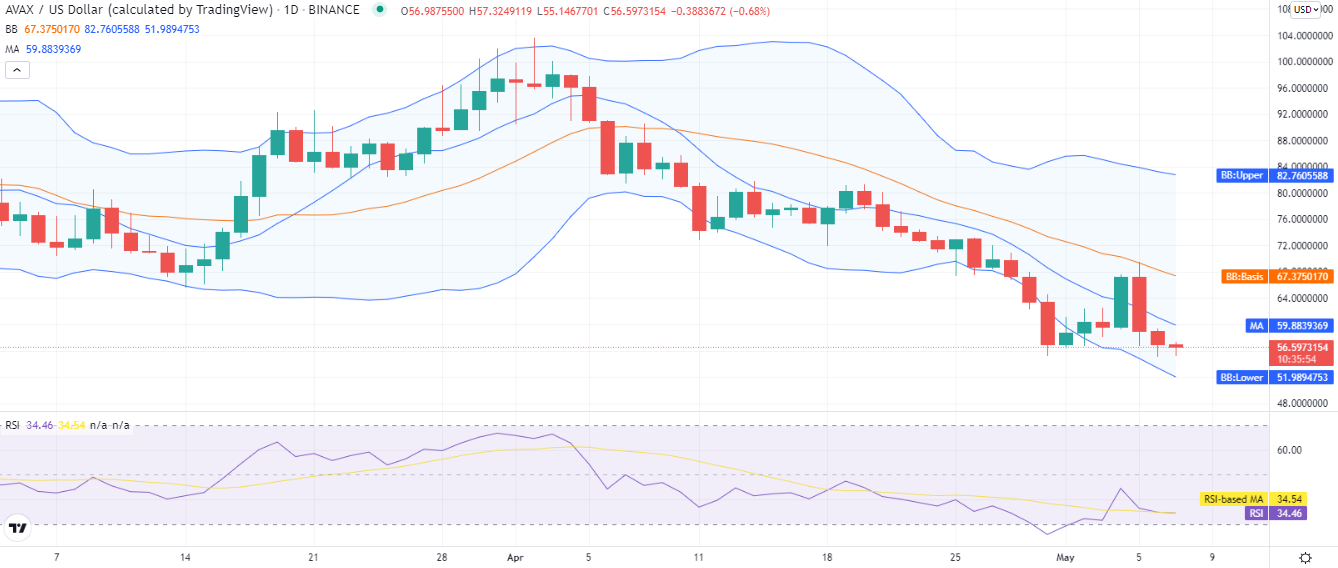
The volatility for AVAX/USD pair is increasing extensively as the Bollinger bands are expanding vastly, with the upper band at $82.7 representing the strongest resistance and the lower band at $51.9 representing the strongest support for AVAX, the average of the indicator is forming at $67.3, and the price is trading far below the mean average of the indicator.
The SMA 20 continues to trade below the SMA 50 curve, which is a bearish indication as the moving average (MA) is present at the $59.8 level. The relative strength index (RSI) is also on a slight downwards slope at index 32, indicating selling activity in the market.
Avalanche price analysis: Recent developments and further technical indications
The 4-hour Avalanche price analysis shows bears are leading the price function for the past few hours, dodging the bullish trend which started late at night, as a red candlestick has appeared on the 4-hour chart as a result of the selling pressure, and the price may decrease further below $56.6 in the coming hours if the selling pressure continues.
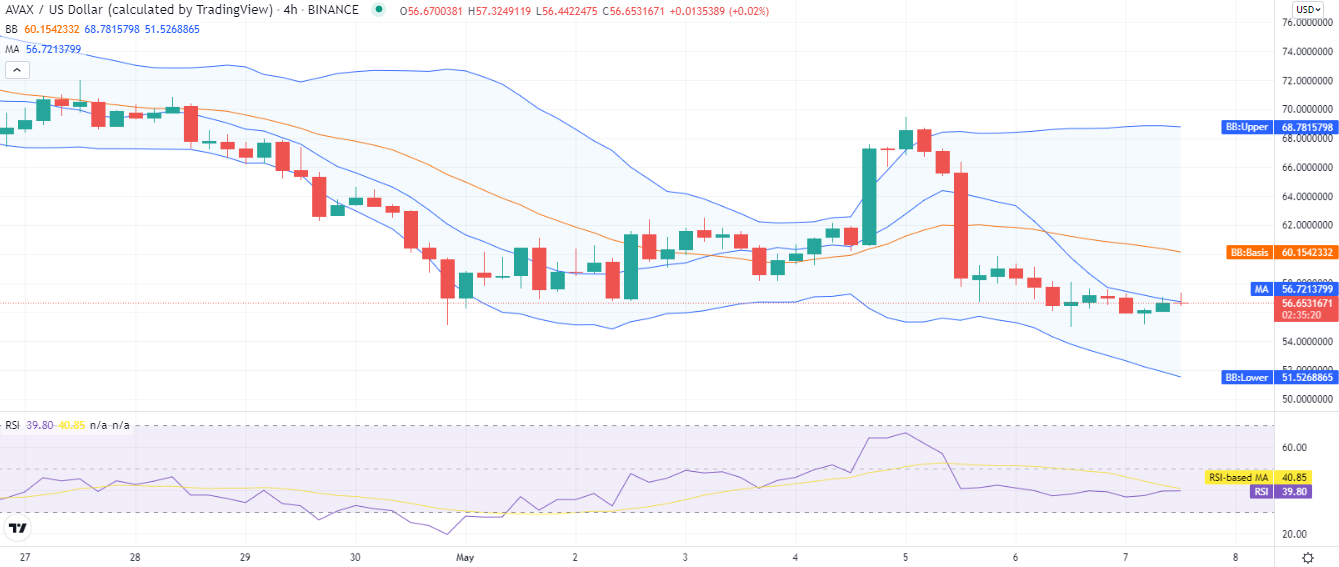
The volatility is high on the 4-hour chart, as the volatility indicator is covering more area. The upper limit of the Bollinger bands is at $68.7, which represents resistance for AVAX/USD, and the lower band is present at $51.5, which represents support for AVAX. The RSI shows a straight horizontal movement and is present in the lower half of the neutral zone at index 39. The RSI being neutral still indicates the bearish pressure in the market.
Avalanche price analysis conclusion
Avalanche price analysis suggests the price has decreased further, and bullish efforts have been rejected. If selling pressure remains persistent, then the cryptocurrency value may decrease further today as a downwards trend has been seen during the last four hours as well.
Disclaimer. The information provided is not trading advice. Cryptopolitan.com holds no liability for any investments made based on the information provided on this page. We strongly recommend independent research and/or consultation with a qualified professional before making any investment decisions.