The Graph price analysis suggests an uptrend as a green candlestick has appeared on the price chart today. Bulls have tried to make a comeback after the price function covered range downwards for the last two days. The upward movement in price has resulted in it recovering up to $0.297 in the last 24-hours. Though the bulls have dominated the trend for today, the bearish presence is also there, and the broader cryptocurrency market is also under a bearish spell, which has affected the GRT price function as well.
GRT/USD 1-day price chart: Price resettles at a $0.297 position after bullish efforts
The 1-day price chart for The Graph price analysis shows chances are increasing for the buyers to secure their permanent lead as the price has been floating above $0.295 and has reached $0.297. In the past few hours, a smaller level of recovery has been reported as the price has increased nominally. The gains have been small, and the chances of an upcoming upswing can be availed if bulls show momentum, which they lack at the moment. The price has been trading lower than the moving average (MA) level as well, which is settling at $0.315 for now.
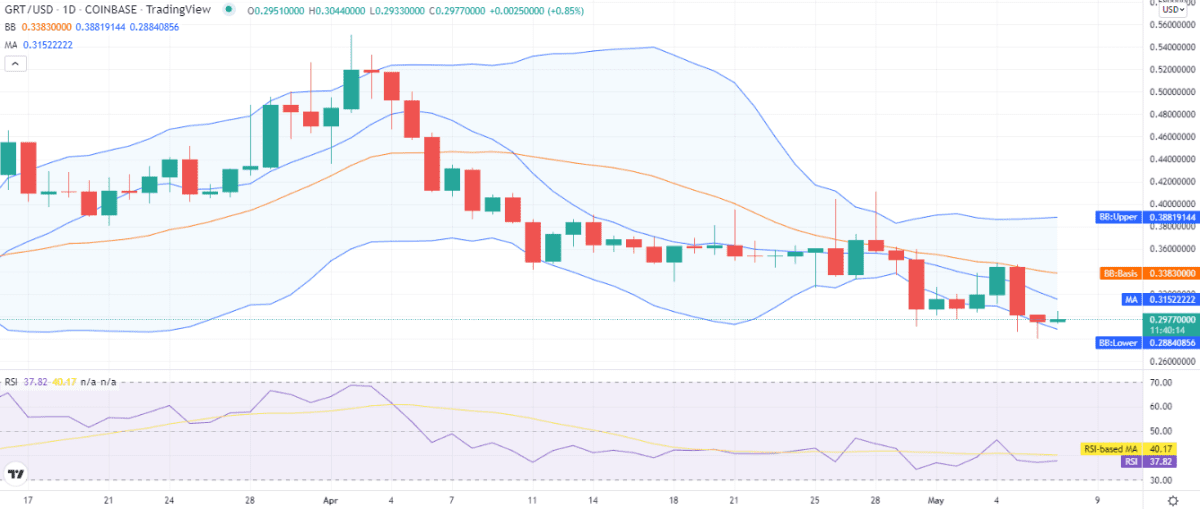
The volatility is increasing as the price underwent a significant fall in the past week. The Bollinger band indicator in the 1-day chart dictates the following values; the upper value is $0.388 representing the resistance, whereas the lower value is $0.288 representing the support. The Relative Strength Index (RSI) is hovering around index 37 as the graph shows horizontal movement, hinting at a lack of momentum from the bullish side and also from the bearish side.
The Graph price analysis: Recent developments and further technical indications
The uptrend initiated by the bulls late at night has undergone reversal as a downturn in price has been reported in the last eight hours. The bears have returned and have been able to degrade the coin value to a certain extent. The cryptocurrency has been devalued to $0.297 after the trends changed recently, but the downfall is also minimal. The four hours price chart points out that the moving average (MA) for GRT/USD is currently at $0.294, which is below the price level.
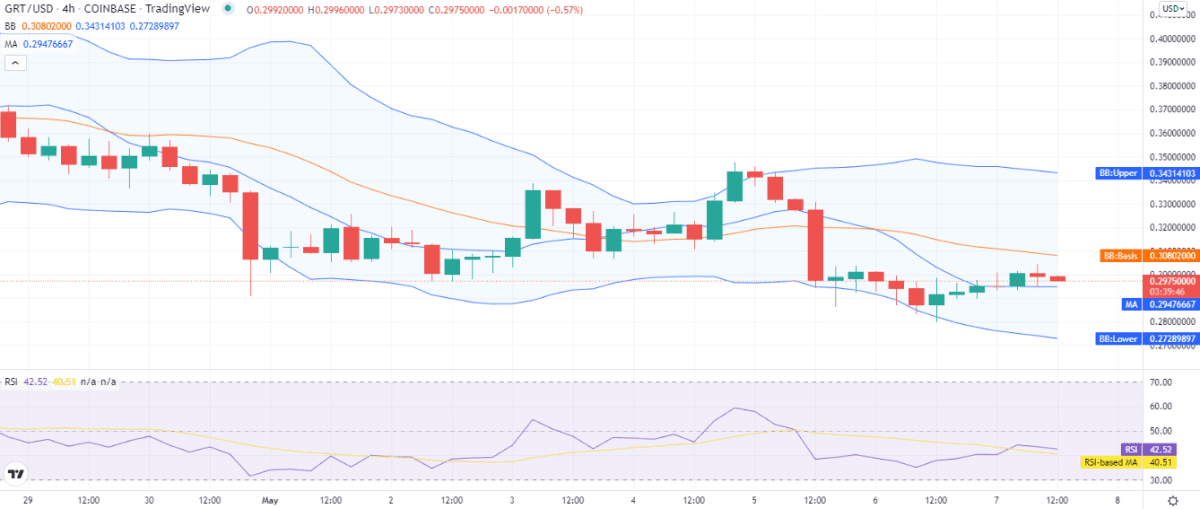
The volatility has been increasing on an hourly basis as the Bollinger bands are expanding, and now the upper Bollinger band is at $0.343, and the lower Bollinger band is at $0.272. The RSI score has gone down to index 42 as a result of the sudden downfall in price.
The Graph price analysis conclusion
The Graph price analysis suggests the price has increased today, and the balance of power is still on the bullish side. However, the bullish momentum is not strong and bearish pressure is there in the market, which has already greatly harmed the buyers. The recovery process has resulted in the price rejoining the $0.297 level today. On the other hand, the downwards price action during the last eight hours means that the coming hours might prove slightly unfavorable for the cryptocurrency.
Disclaimer. The information provided is not trading advice. Cryptopolitan.com holds no liability for any investments made based on the information provided on this page. We strongly recommend independent research and/or consultation with a qualified professional before making any investment decisions.