IOST is a high-speed decentralized blockchain network based on PoB (Proof-of-Believability) algorithm. It facilitates hack-free and safe digital money transactions and is highly scalable. The ‘IOS’ in ‘IOST’ stands for ‘Internet Of Services’ and this network provides a robust platform for creating a service-oriented blockchain network. IOST is the native token of this ecosystem and the technical analysis is as follows:
Past Performance
On April 24, 2021, IOST started trading at $0.05. On April 30, 2021, IOST closed at $0.069. Thus, in the past week, the IOST price has surged by roughly 38%. In the last 24 hours, IOST has traded between $0.065-$0.069.
https://s3.tradingview.com/snapshots/r/RIDazWsX.png
Day-Ahead and Tomorrow
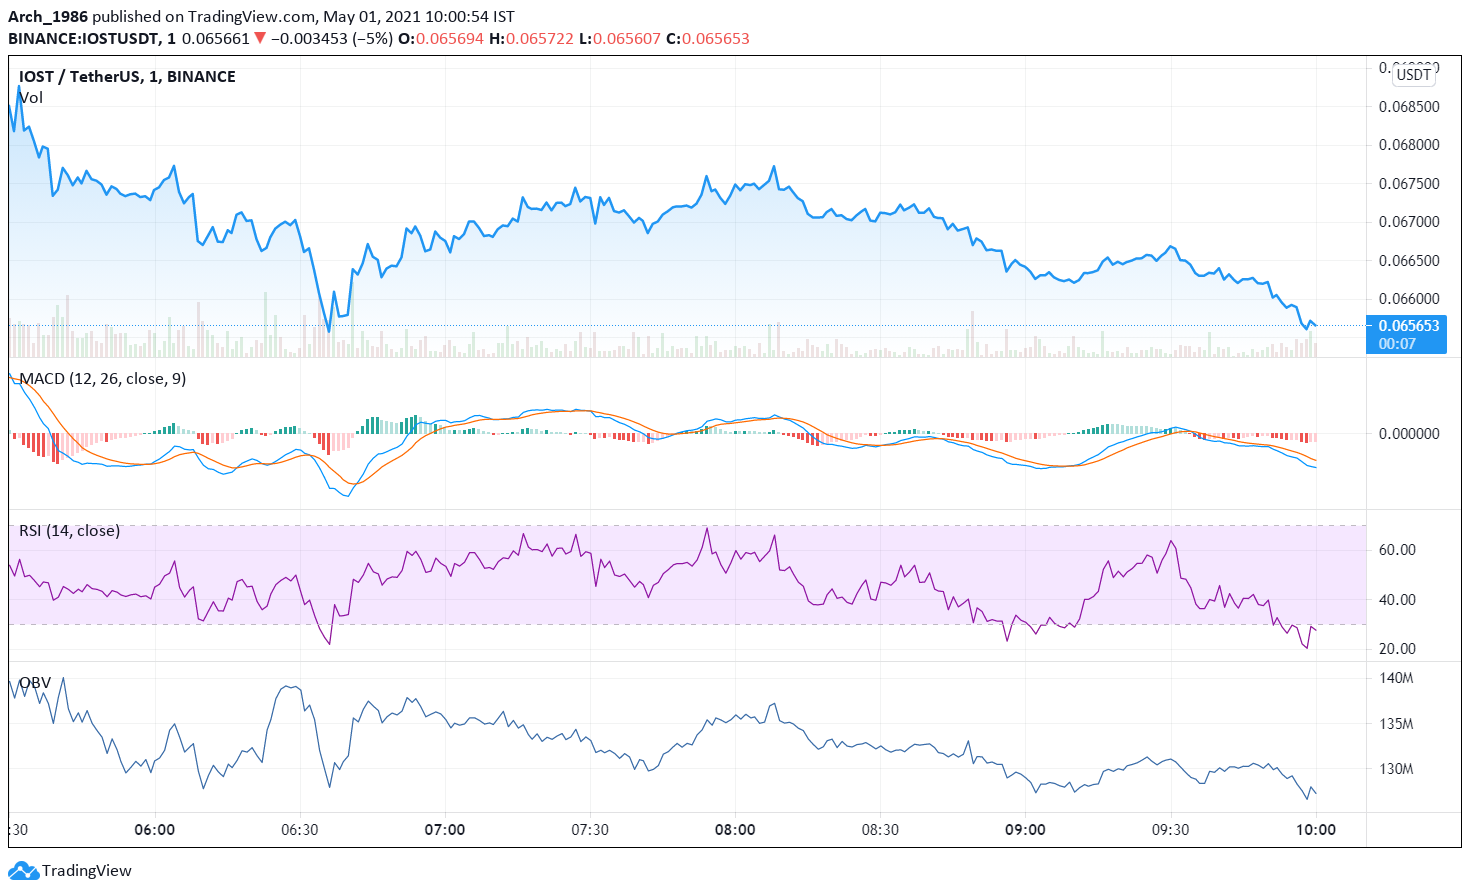
Currently, IOST is trading at $0.066. The price has declined from the day’s opening price of $0.069. Thus, the market seems to be downtick.
The MACD and signal lines are negative. Moreover, the bearish crossover by the MACD line over the signal line has occurred. Thus, the overall market momentum is bearish. Hence, the price is likely to decline further.
Currently, the RSI indicator is at 44%. It has just rallied from the ‘oversold’ region. Selling pressures remain high. Hence, the RSI indicator is giving further credence to a price drop.
The OBV indicator has fallen steeply. But, for the last few minutes, it has been slowly rising. Thus, buying volumes are picking up. In other words, we can expect the price to rise after some time.
In a nutshell, all three oscillators have indicated a price fall for now. However, we may expect the price to propel in some time as buying activity surpasses selling activity in the IOST market.
IOST Technical Analysis
As per technical analysis, the price is presently below the second Fibonacci pivot support level of $0.065. It may soon fall below the third support level of $0.064 as well. Thereafter, we have to wait and watch if a bearish trend reversal occurs and the price starts rising.
The price has tested and fallen below the 23.6% FIB retracement level of $0.066. By day end, if the price breaks out of the 76.4% FIB retracement level of $0.068, then probably a price uptrend has set in. In that case, we can expect the price upswing to continue tomorrow as well.