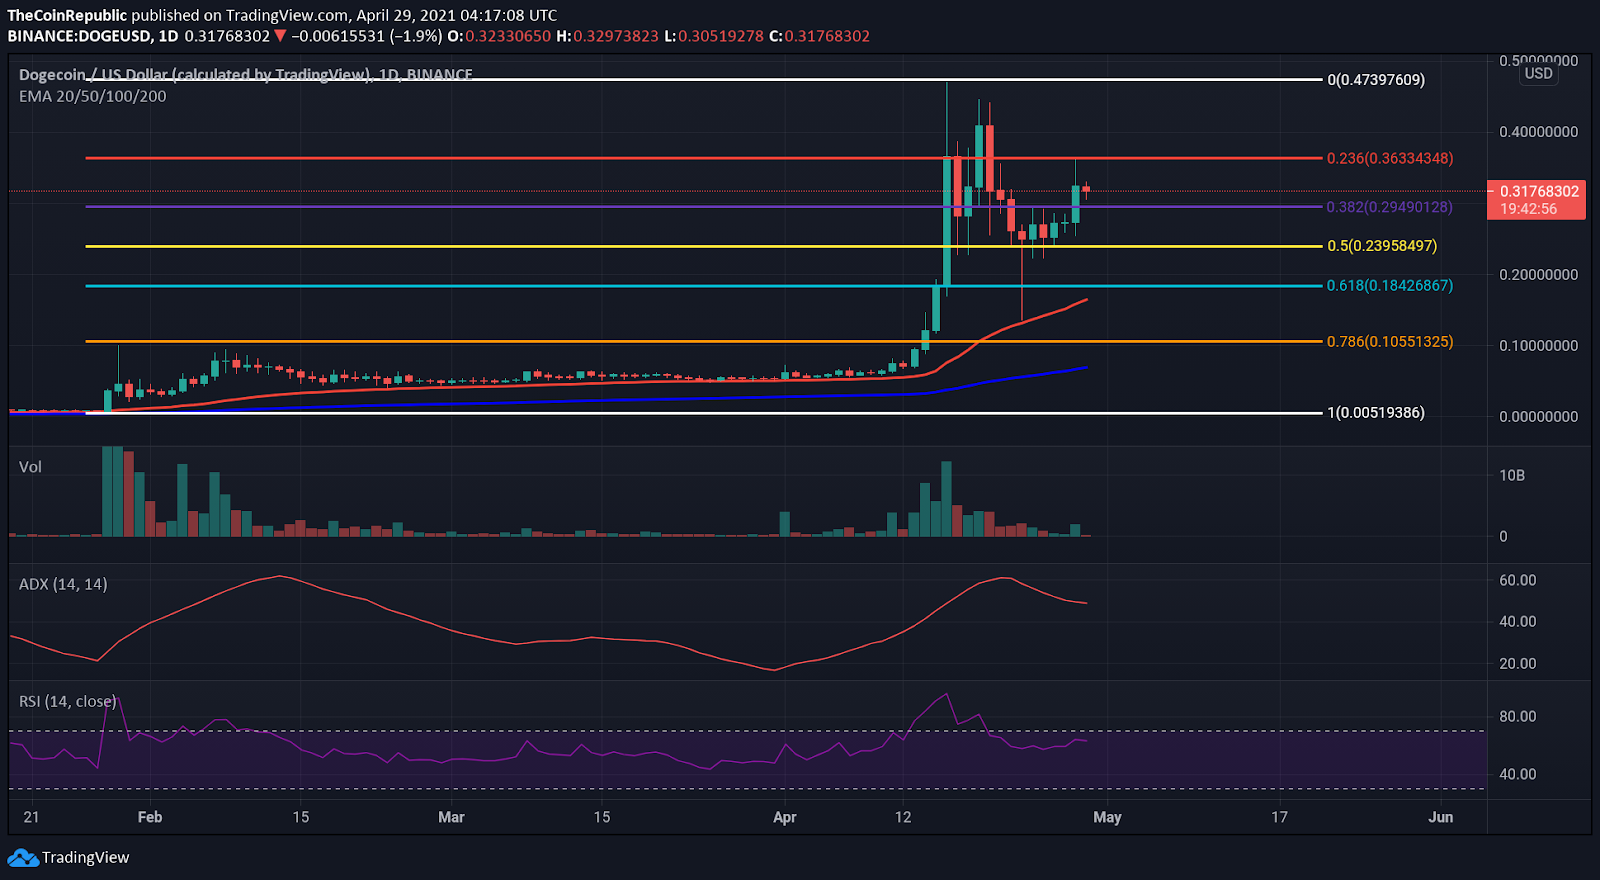
- DOGE coin price boosted 120% after taking support from the 0.5 Fibonacci level
- Currently, the coin price is facing resistance from the $0.36 level after the boost. But the price is still above major 50 & 200 EMA in the daily timeframe.
- The DOGE/BTC pair is trading at 0.000005803 with an intraday growth of 8.9%
Source- tradingview
The DOGE coin price fell more than 50% before taking support from the 0.5 Fibonacci level, i.e., $0.239. The coin price consolidated for a few days just before an engulfing green candlestick was formed, implying the start of an uptrend. The increasing buying volume in comparison with the declining selling volume does imply that bulls are more powerful. The live Dogecoin price today is $0.316761 with a 24-hour trading volume of $15,007,108,390. Dogecoin is up 23.08% in the last 24 hours. The live market capitalization of the coin is $40,981,240,818.
Trendline may continue even after the breakout
Source – tradingview
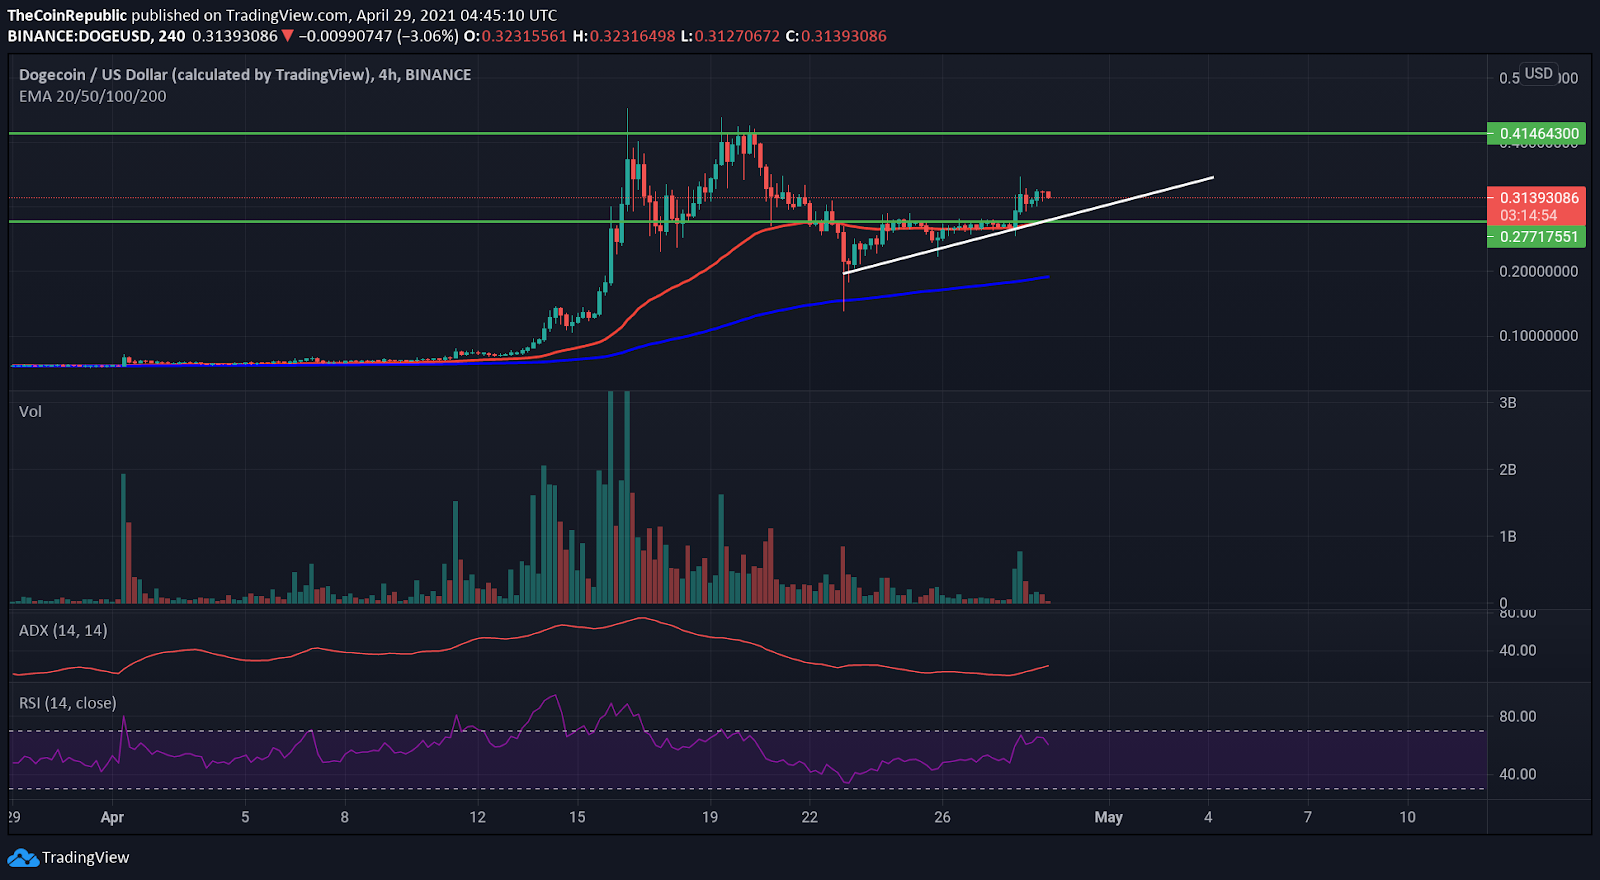
DOGE has performed a breakout of an ascending triangle and crossover major 50 EMA. Along with the pattern, the coin price has given a breakout of the $0.27 level. It performed a short pullback indicating a retest of the breakout.
The trendline of the ascending triangle might continue to work and push the price back up. The coin price might face resistance from the $0.41 level as it is an important immediate resistance level. Breakout of this resistance level might boost the price another 20% up. The support level of $0.27 is the immediate support level.
As per the 4-hour timeframe, the coin price is trading above the 50 (red) and 200 (blue) EMA, which indicates an uptrend, and the coin price driving back down can be considered a retest of the breakout.
The RSI (slightly bearish) indicates slight bearish momentum while trading at 60. The RSI line is dipped and is now heading back from the overbought zone.
The ADX indicates a slow growth in momentum as it is trading at 26 while the slope in ADX is slightly increasing.
Conclusion – DOGE coin price is exhibiting a retest of the breakout of the ascending triangle pattern suggesting the start of an uptrend. The trendline of the ascending triangle might still boost the price up after successful retest completion. The increase in buying volume is providing some sort of assurance, but the increased volatility in the market can change the course of the trend. Hence, early traders must be careful.
Support- $0.27 and major EMAs
Resistance- $0.41
Vishal
 thecoinrepublic.com