
Past Performance
March 2021 has been favorable for DGB. On April 15, 2021, DGB started trading at $0.104. As of April 21, 2021, DGB closed at $0.153. Thus, in the past week, the DGB price has surged by roughly 47%. In the last 24 hours, DGB has traded between $0.147-$0.168.
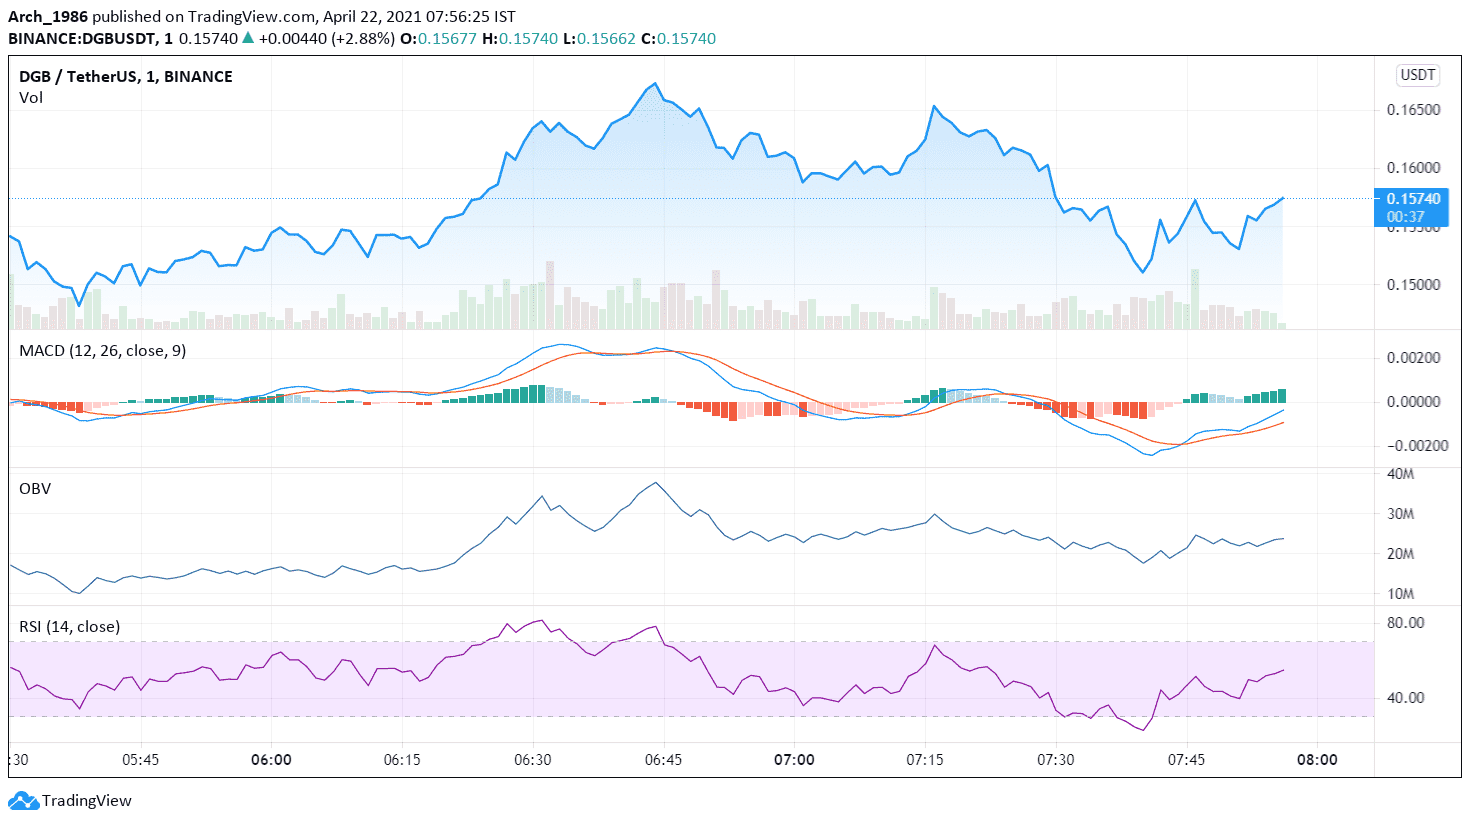
https://s3.tradingview.com/snapshots/u/UOYfLN4o.png
Day-Ahead and Tomorrow
Currently, DGB is trading at $0.157. The price has increased from $0.153 since the morning. Thus, the market seems to be uptick.
The MACD and signal lines are negative. Thus, the overall market momentum is bearish. However, a bullish crossover by the MACD line over the signal line has occurred. Moreover, both the lines are close to the zero line and may change sign soon. Thus, a trend reversal is likely. Hence, we can expect the price to rise further in some time.
The OBV indicator has started rising gradually. Thus, buying volumes are picking up. Like the MACD indicator, the OBV indicator is showing that the price is likely to go up further in some time.
The RSI indicator faced rejection at 65% and fell to the current level of 60%. However, buying pressures are still higher than selling pressures. Hence, like the other two indicators, the RSI oscillator is also pointing towards a price rise.
DGB Technical Analysis
As per technical analysis, the price is currently above the Fibonacci pivot point of $0.156. As all the oscillators have indicated a price rise, we can expect the DGB price to surpass the first resistance level of $0.164 soon.
The price has tested and broken out of the 38.2% FIB retracement level of $0.16. If the price breaks out of the 23.6% FIB retracement level of $0.163 in some time, we can be assured that the bulls are strong. In that case, the price uptrend is likely to continue today as well as tomorrow.