In new technical analysis, IOST is a Proof-of-Believability-based blockchain network in the DeFi market with super-fast transaction speed. The architecture of this network is such that it facilitates seamless online transactions in digital money and meets the global security and scalability standards. IOST is the native token of this ecosystem.
Past Performance
On April 13, 2021, IOST started trading at $0.061. As of April 19, 2021, the closing price of IOST was $0.07. Thus, in the past week, the IOST price has surged by approximately 15%. In the last 24 hours, IOST has traded between $0.06-$0.071.
https://s3.tradingview.com/snapshots/v/Vry7YdWN.png
Day-Ahead and Tomorrow
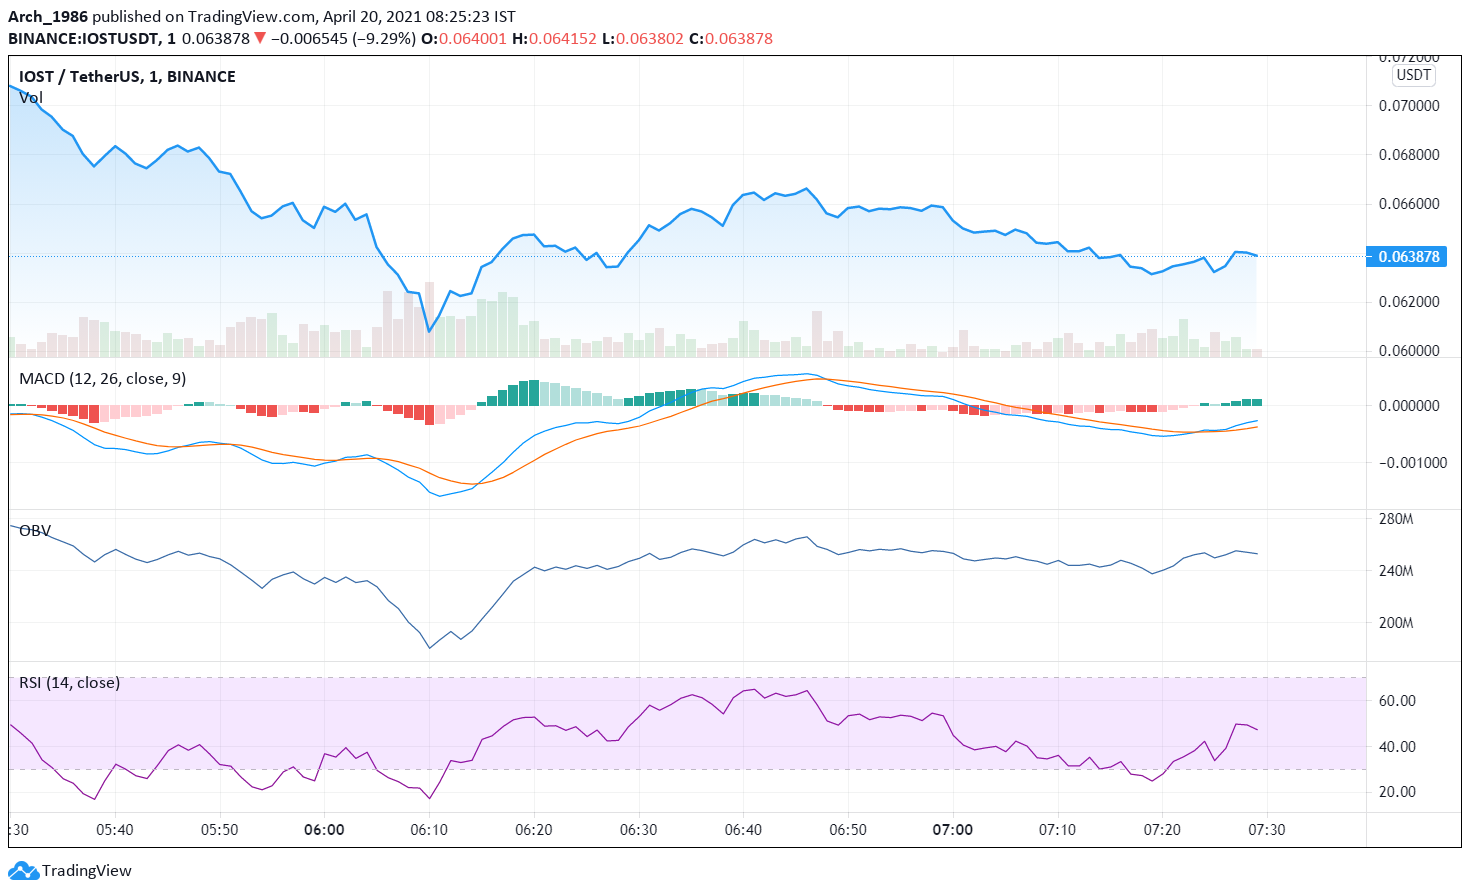
Currently, IOST is trading at $0.064. The price has gradually decreased since morning from $0.07. Thus, the market seems to be downtick.
The MACD and signal lines are negative. Thus, the overall market momentum is bearish. However, a bullish crossover by the MACD line over the signal line has occurred. Thus, we can expect some intermittent price increases amidst an overall bearish price trend. Thus, price corrections are happening in the IOST market.
The OBV indicator, on the other hand, is upward sloping. This implies that buying activity is higher than selling activity in the IOST market. There is a bullish divergence here indicating that the bulls are slowly gaining strength. Thus, the OBV indicator is pointing towards a price rise. However, we have to wait and watch to understand if a bullish trend has indeed set in.
The RSI indicator faced rejection at 35% and is currently at 48%. Thus, buying pressures are gradually building up. Thus, the RSI indicator is also pointing towards a price increase.
In a nutshell, a price rise is on the horizon. But, it is too early to confirm if the price rise is a part of the price correction process amidst a bearish trend or an indication of a bullish trend.
IOST Technical Analysis
As per technical analysis, the price is presently below the first Fibonacci pivot support level of $0.063. The price may soon rise up to the Fibonacci pivot point of $0.067.
The price has tested and fallen below the 38.2% FIB retracement level of $0.064. A bullish trend has indeed set in if the price breaks out of the 76.4% FIB retracement level of $0.068, by day end. In that case, we can expect the price uptrend to continue tomorrow as well.