DIA (DIA) has been decreasing since reaching an all-time high on April 5. However, it has bounced on the previous all-time high resistance.
Dogecoin (DOGE) is trading inside an ascending triangle, from which a breakout is expected.
Basic Attention Token (BAT) has potentially created a double top pattern.
DIA (DIA)
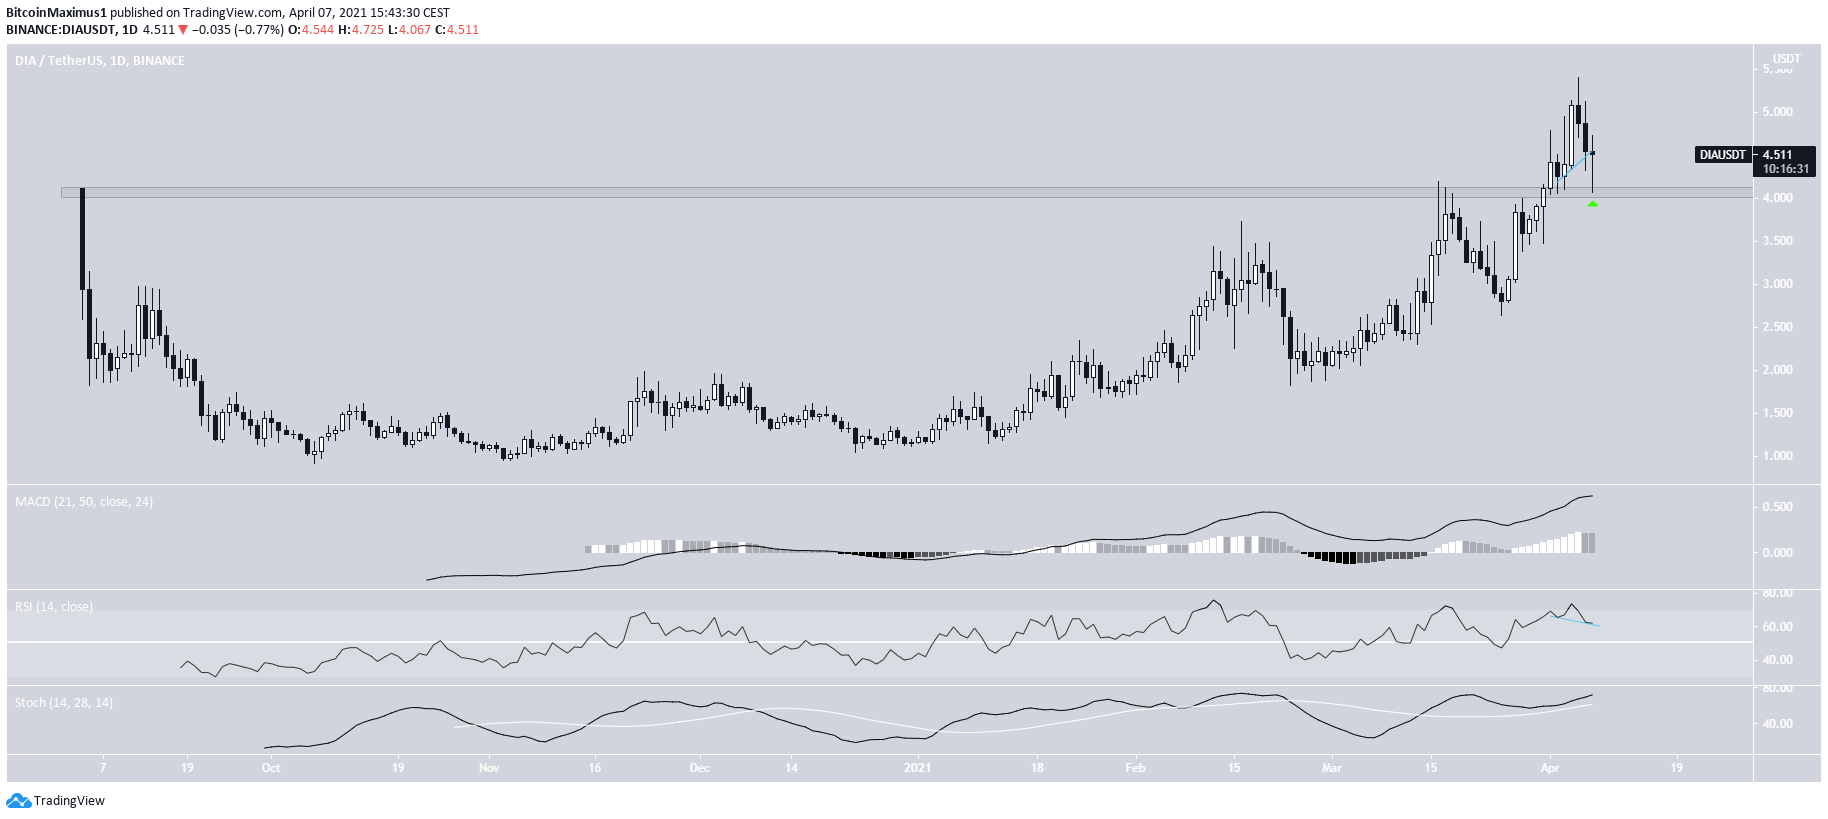
DIA has been decreasing since April 5, when it reached an all-time high price of $5.40.
However, the drop took it to the $4.05 area, which previously acted as support. DIA bounced as soon as it reached it and is creating a long lower wick.
This is seen as a sign of bullish pressure.
Also, technical indicators are bullish. Both the MACD & Stochastic oscillator are increasing. Besides, the RSI has generated hidden bullish divergence.
Therefore, a new all-time high for DIA is expected.
Highlights
- DIA reached a new all-time high on April 5.
- It is re-testing the $4.05 level.
Dogecoin (DOGE)
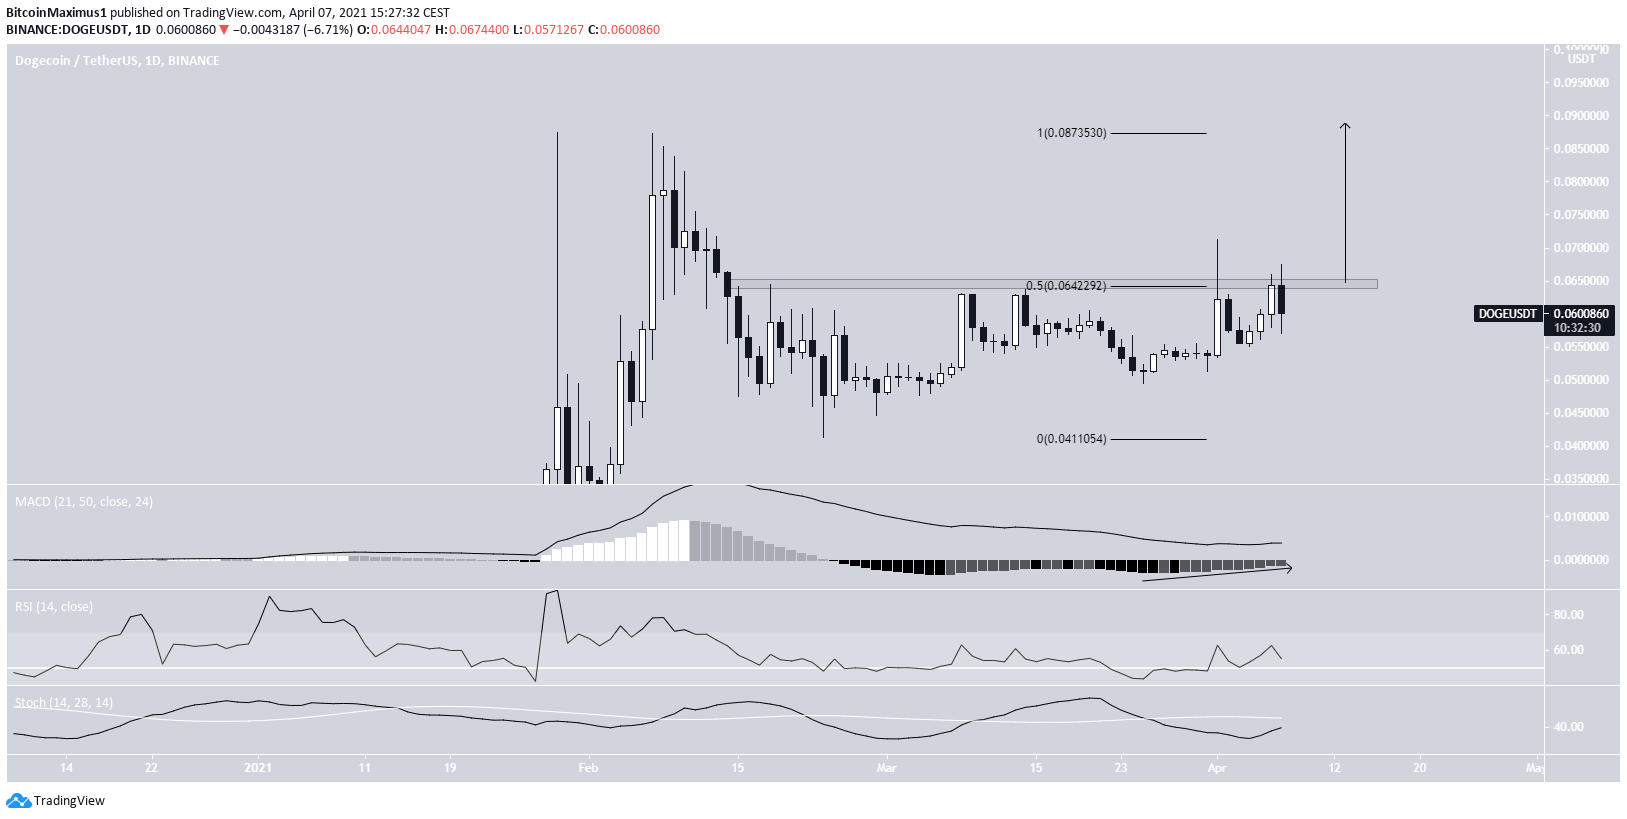
DOGE has been moving downwards since reaching a high of $0.086 on Feb. 17. The decrease continued until Feb. 23, when DOGE began to bounce.
Afterward, the ensuing upward movement took it to the $0.064 resistance area. Besides being a horizontal resistance level, it is also the 0.5 Fib retracement of the previous decrease.
The movement since the bounce resembles an ascending triangle, which is considered a bullish pattern.
So far, DOGE has made four unsuccessful breakout attempts. Despite this, technical indicators are bullish.
The MACD has given a bullish reversal signal, the RSI has crossed above 50, and the Stochastic oscillator is very close to making a bullish cross.
A breakout that travels the entire height of the pattern would take it all the way to the all-time high resistance at $0.087.
Highlights
- DOGE is facing resistance at $0.064.
- It is trading inside an ascending triangle.
Basic Attention Token (BAT)
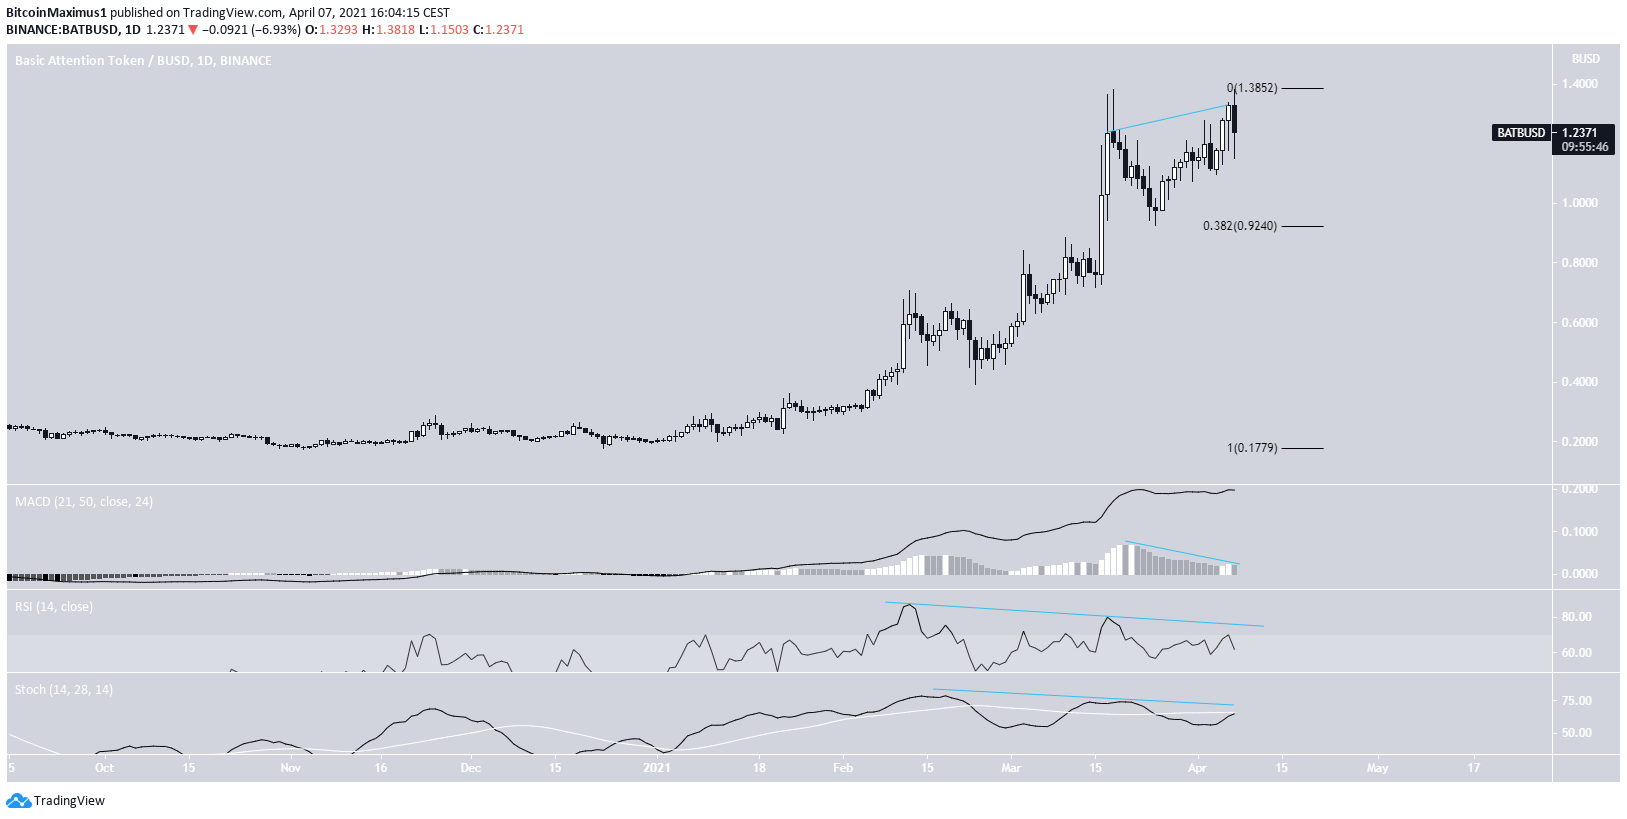
BAT has been increasing since March 25. The increase took it to a new all-time high price of $1.38 on April 7.
However, BAT dropped almost immediately afterward.
This has created what looks like a double top, which is considered a bearish reversal pattern.
Also, the RSI, MACD & Stochastic oscillator have generated bearish divergence.
Therefore, the most likely scenario would have BAT dropping towards the closest support at $0.92.
Highlights
- BAT has created a double top pattern.
- Technical indicators are showing weakness.