PancakeSwap (CAKE), Compound (COMP), and Maker (MKR) technical analysis point to asset resilience despite price shocks. Still, MKR/USD prices can reach $3k, while CAKE prices could soar to $30 if bulls flock back, forcing prices above essential sell walls. However, COMP doesn’t show any major change.
PancakeSwap (CAKE)
In today’s PancakeSwap technical analysis, we check the CAKE performance – the governance token on the leading token swapping platform of the Binance Smart Chain-based DeFi protocol. BSC distinguishes itself with relatively high throughput and negligibly low trading fees.
Past Performance of PancakeSwap
The CAKE price is stable on the last day but weaker in the past week of trading. Nonetheless, the token is range-bound in a firm uptrend.
CAKE/USD is presently trading between $16 and $18 with interest from the trading community. Volumes are up 26 percent in 24 hours, according to trackers.
Day-Ahead and Tomorrow: CAKE
CAKE is changing hands at $17 and is less than $2 from Mar 2021 highs.
At spot rates, bulls stand a chance, as PancakeSwap technical analysis suggests. From the daily chart, there are series of lower lows with comparatively low trading volumes viz-a-viz gains of late Mar 2021.
The CAKE/USD price is trading within a bullish breakout pattern following gains of late Mar 2021. Also, Bollinger Bands (BB) are diverging, pointing to increasing volatility while the middle BB acts as the flexible support.
CAKE Technical Analysis
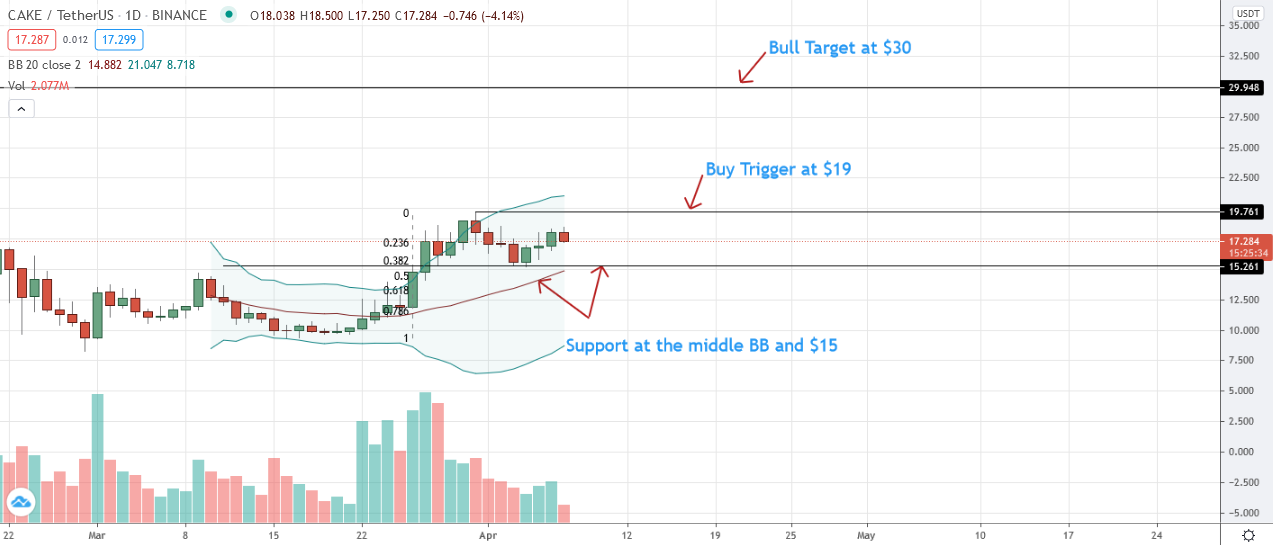
The path of the least resistance is upwards.
In a bullish breakout pattern, a revival above $19 would potentially lift CAKE prices to Feb 2021 highs of $30.
It is provided CAKE/USD prices hold above $15 and the middle BB.
Steep losses below $14 could spook bulls in a bear reversal.
Compound (COMP)
Compound is one of the largest DeFi protocols, and COMP, its governance token, is one of the most actively traded assets.
From Compound technical analysis, traders continue to pour in on the token as DeFi users lend and borrow at competitive rates.
Past Performance of Compound
The COMP price started off Apr 7 on a weaker foot, sliding seven percent on the last day. COMP/USD prices are within a $40 range with caps at $470 and $510.
According to trackers, the token is trading at $371 as participation—judging from the past average trading volumes, shrink to $138.8 million.
Day-Ahead and Tomorrow
COMP is under pressure, dropping from Q1 2021 highs. Even so, confidence remains high since the correction is with comparatively lighter volumes.
Also, COMP/USD price is within Apr 4 bull bar, a net bullish from an Effort-versus-Results perspective.
Meanwhile, bars are held within the upper BB and the 20-day moving average, suggesting bulls.
Despite traders’ confidence, COMP bulls must sustain prices above $410—the middle BB, for this Compound technical analysis to hold for optimistic buyers.
COMP Technical Analysis
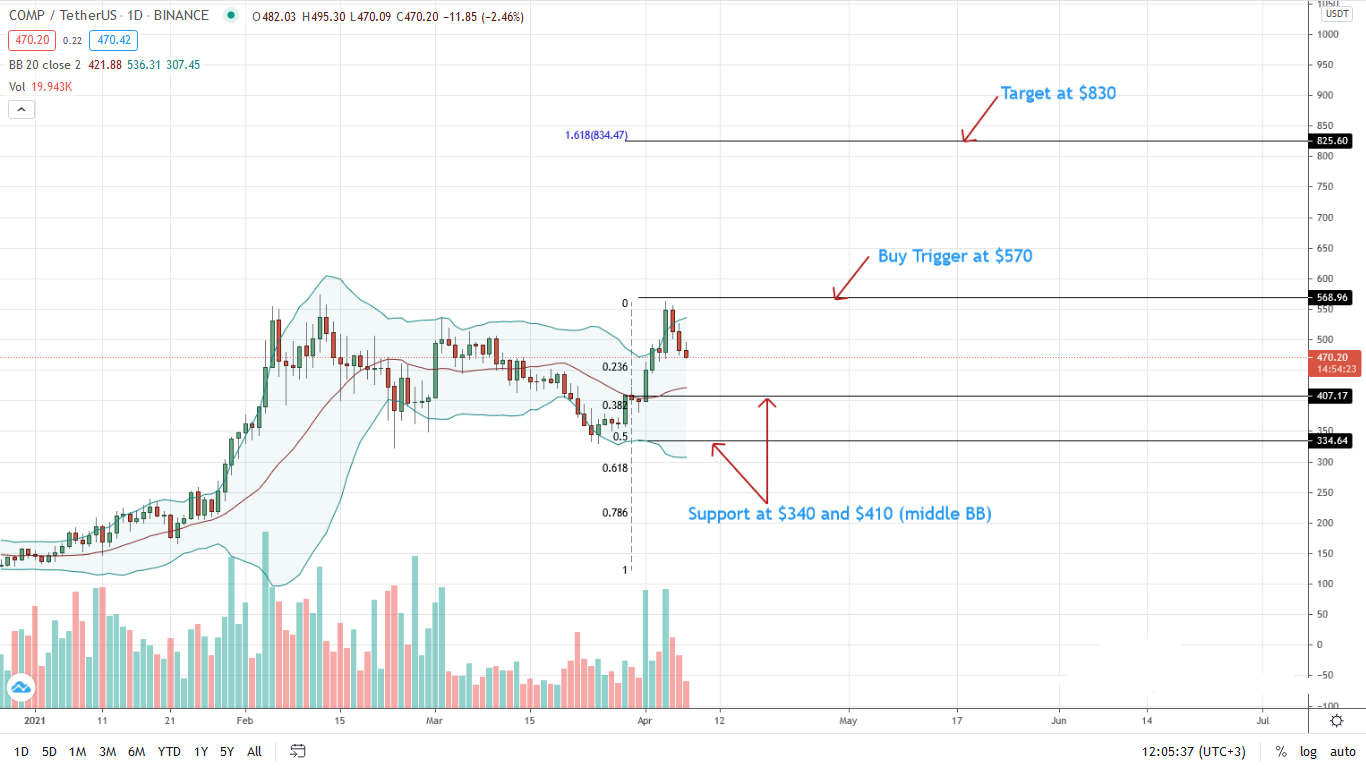
Buyers are in control. However, COMP/USD is within a bull flag.
Zones between $340 and $410 flashing with critical Fibonacci retracement levels of the Q1 2021 trade range would define the COMP price action.
A break above $560 could spark a wave of demand, lifting prices to $830, the 1.618 Fibonacci extension level of the same trade range.
Maker (MKR)
The MakerDAO protocol is one of the largest DeFi with over $8 billion in TVL. After exemplary performance over the last five months, today’s Maker technical analysis looks at candlestick arrangements and what traders should expect.
Past Performance of Maker
The MKR price is under pressure, cratering in the last few trading days. MKR/USD prices are relatively stable on the previous day but up five percent week-to-date. The token is trading within a broader $2300 range with caps at $2.1k and $2.3k.
On the other hand, trading volumes are up 41 percent, rising to $118 million.
Day-Ahead and Tomorrow
MKR is trading at $2,188 as of writing on Apr 7. There are hints of weakness, but the accompanying participation is low.
Accordingly, this supports bulls in the immediate term—an opportunity for bulls to buy the dips.
There is a double-bar reversal pattern with a follow-through, albeit with low trading volumes. Bands are narrow, indicating low volatility.
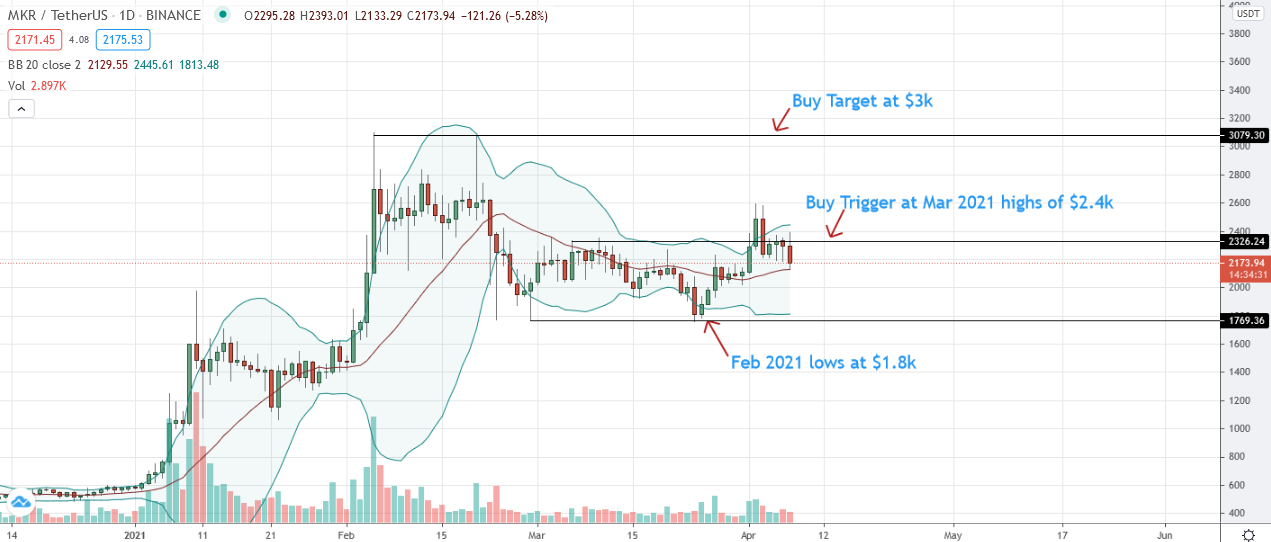
Meanwhile, MKR/USD prices are within a broader bull flag with caps at $1.8k and $2.4k, respectively.
MKR Technical Analysis
MKR/USD prices remain bullish but could correct in the immediate term. Crypto technical indicators point to exhaustion, leading to low volatility.
Traders are watching reactions at $2.4k and $1.8k on the lower end. With a double-bar reversal pattern and low trading volumes, aggressive traders can load the dips.
However, losses below the middle BB and an uptick with participation may see MKR prices sliding to $1.8k. A similar breakout above $2.4k opens MKR/USD to Feb 2021 high of $3k.