EOS has broken out above a minor resistance level at $4. This ceiling has been in place since August 2019.
EOS is expected to resume its upward movement and increase towards the resistance levels outlined below.
EOS Long-Term Levels
EOS had been following a descending resistance line since May 2019 before a high of $8.65 was reached. EOS made three unsuccessful breakout attempts before finally moving above the line in Nov. 2020.
After validating the line as support, EOS began the upward movement that is still ongoing.
Technical indicators are bullish. The RSI, MACD, and Stochastic oscillator are increasing. The latter has just made a bullish cross.
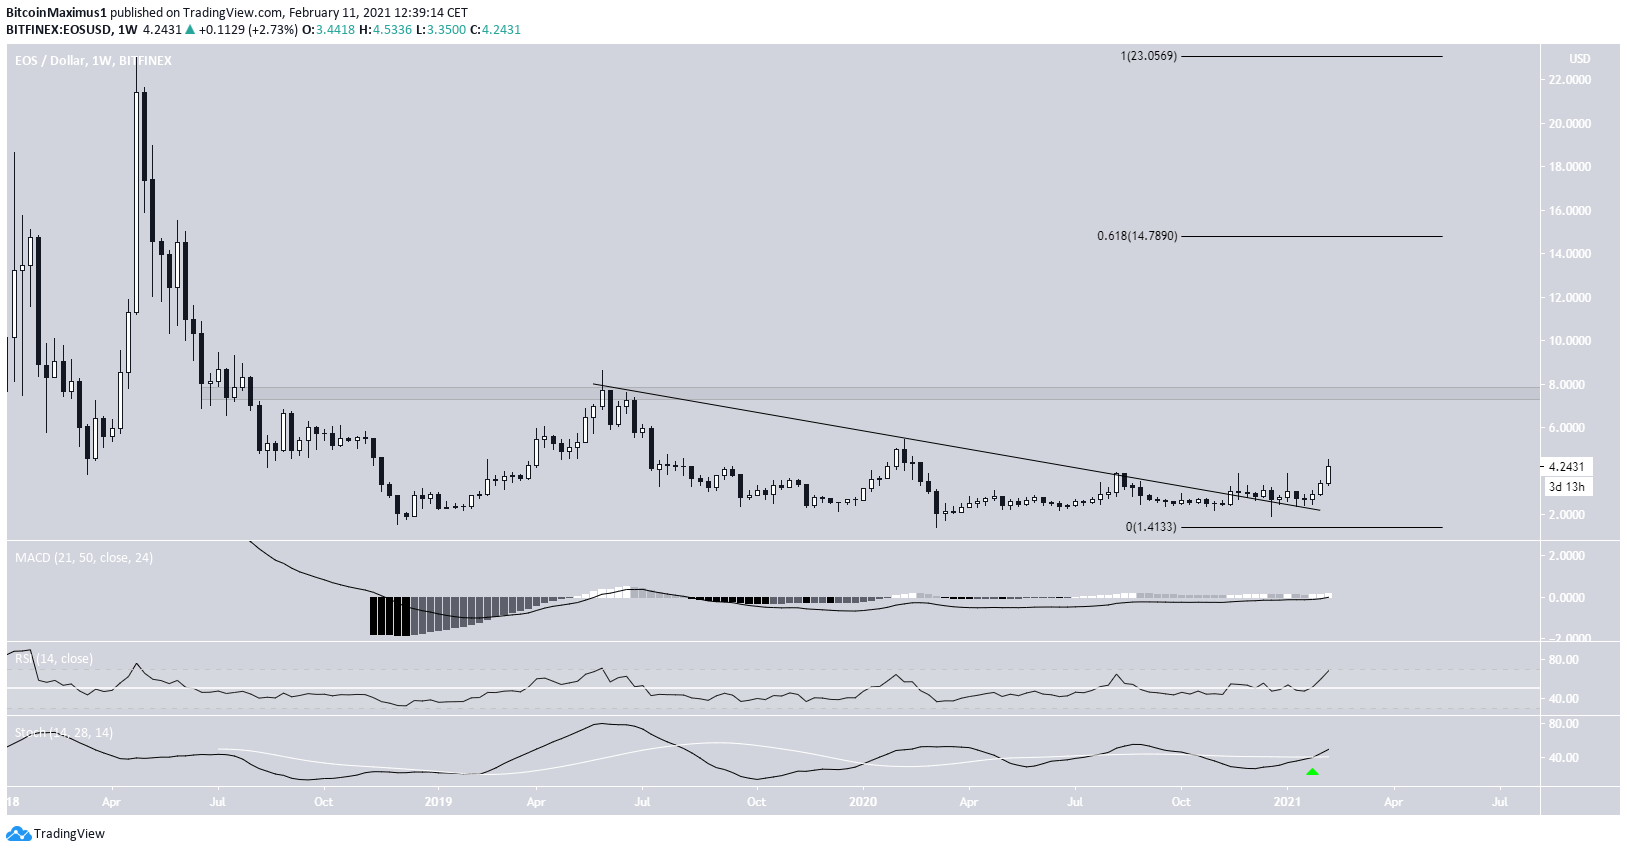
The closest resistance areas are found at $7.65 (horizontal resistance level) and $14.80 (0.618 Fib retracement level).
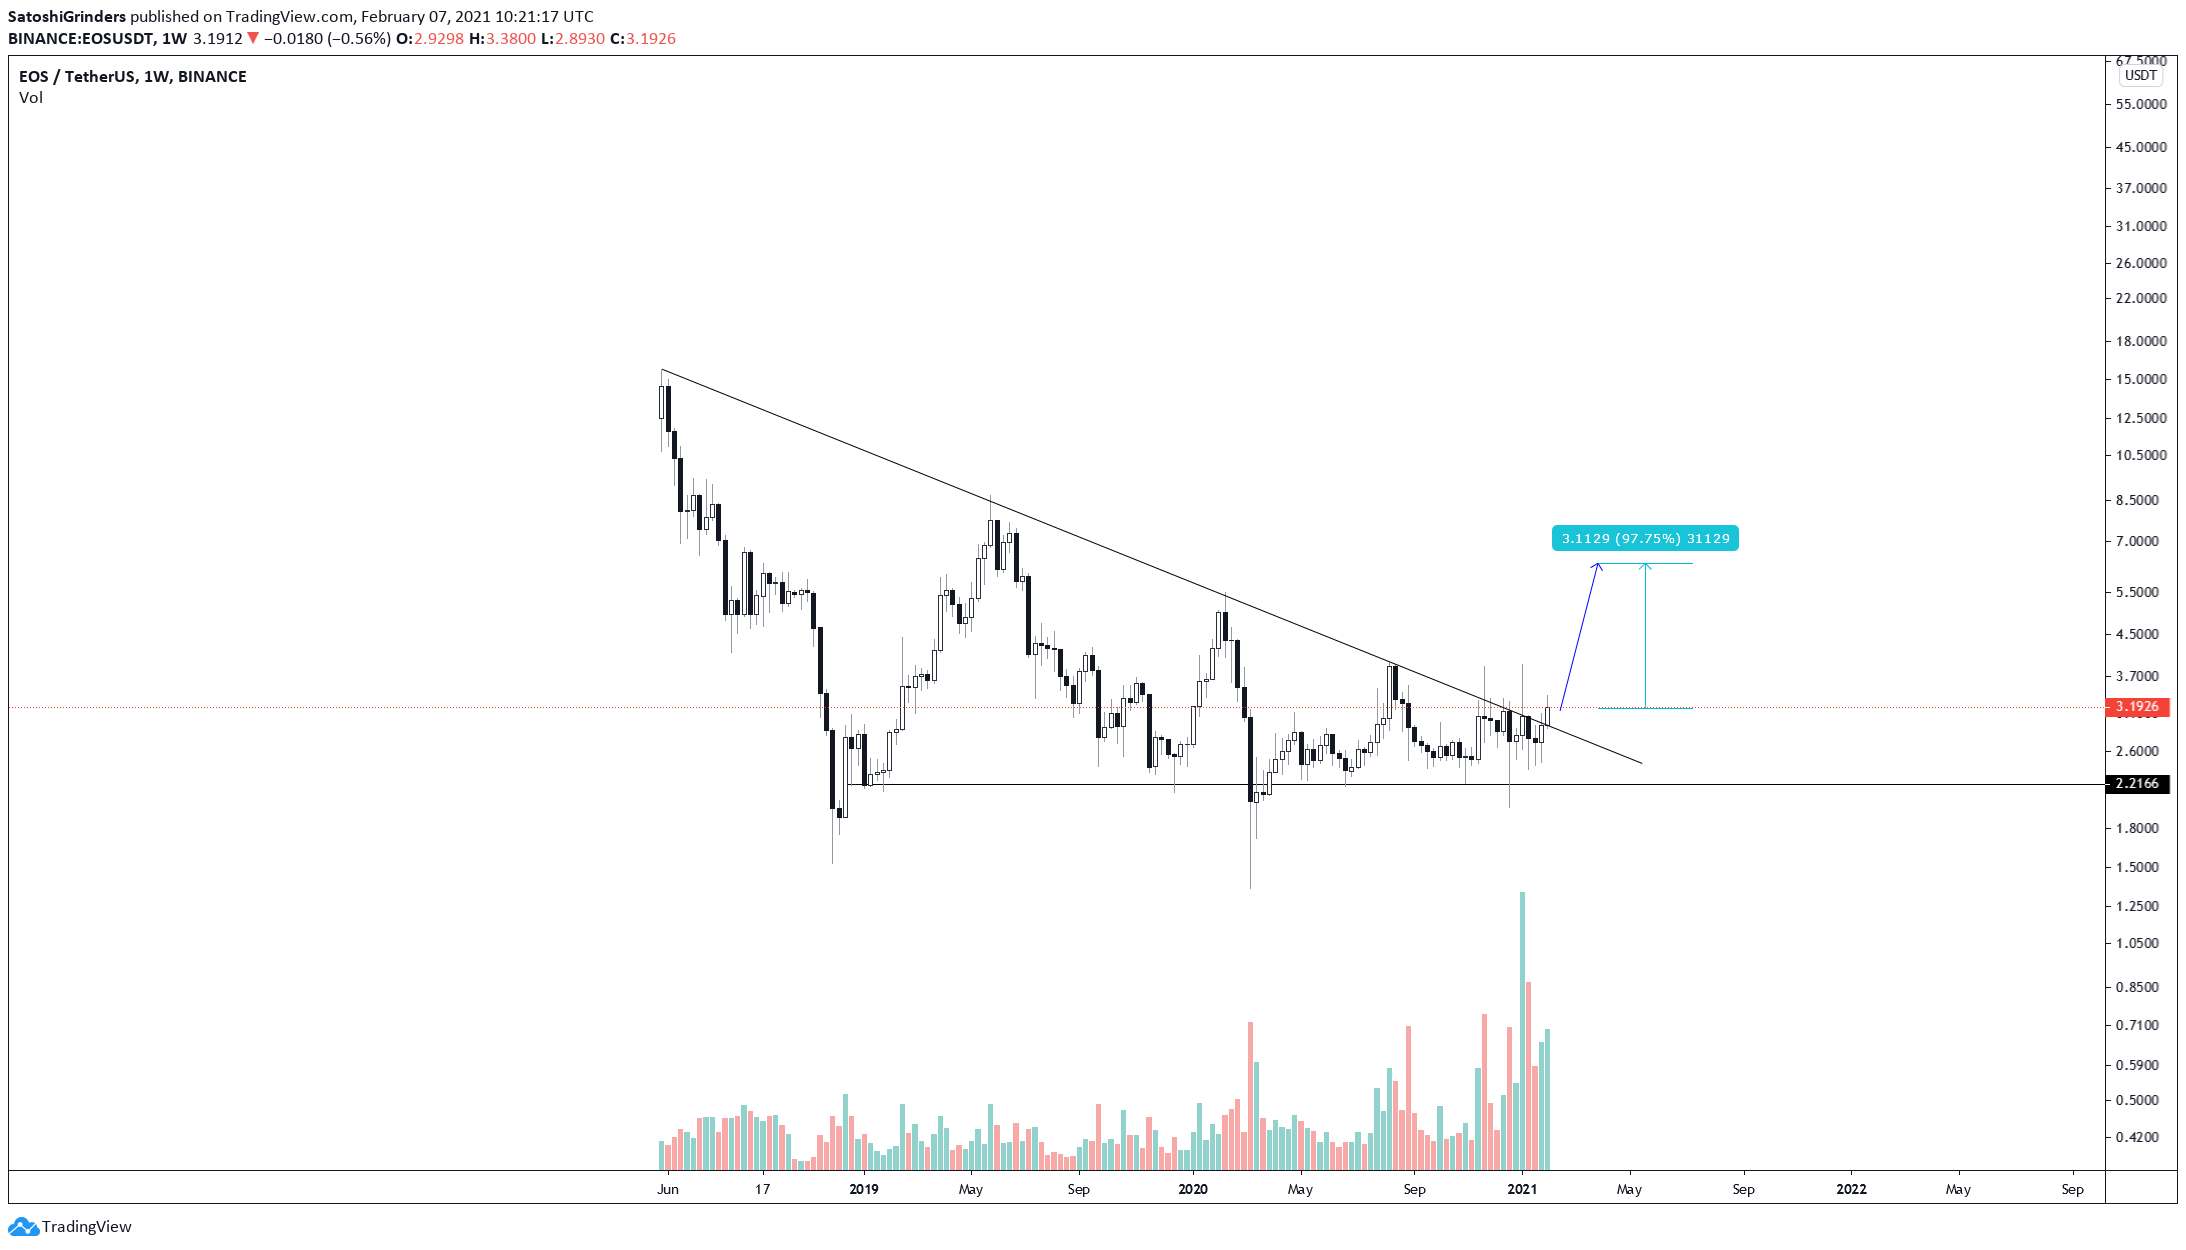
Cryptocurrency trader @Thebull_Crypto outlined an EOS chart, stating that the price is likely to increase to $7. The resistance line outlined is the same, and the target fits with our $7.65 resistance target.
Daily Movement
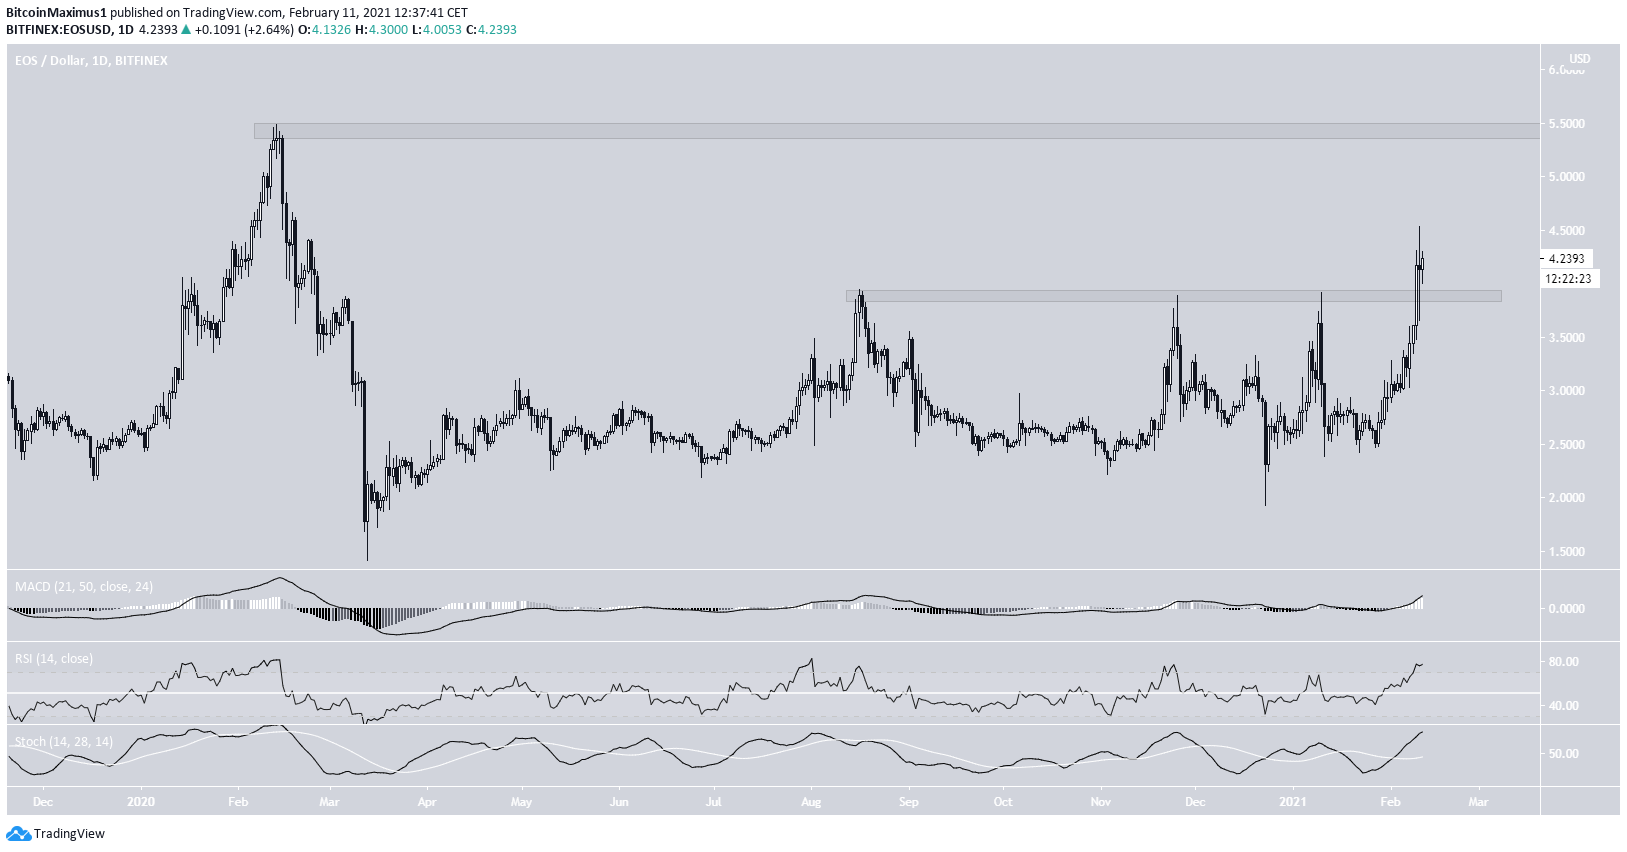
The daily chart shows that EOS broke out above the minor $4 resistance area on its fourth try. After validating it as support, EOS has begun to move upwards.
Similar to the weekly time-frame, technical indicators in the daily chart are also bullish.
While there is a minor resistance area at $5.50, it would be more likely for EOS to increase at least to the $7.65 area.
Wave Count
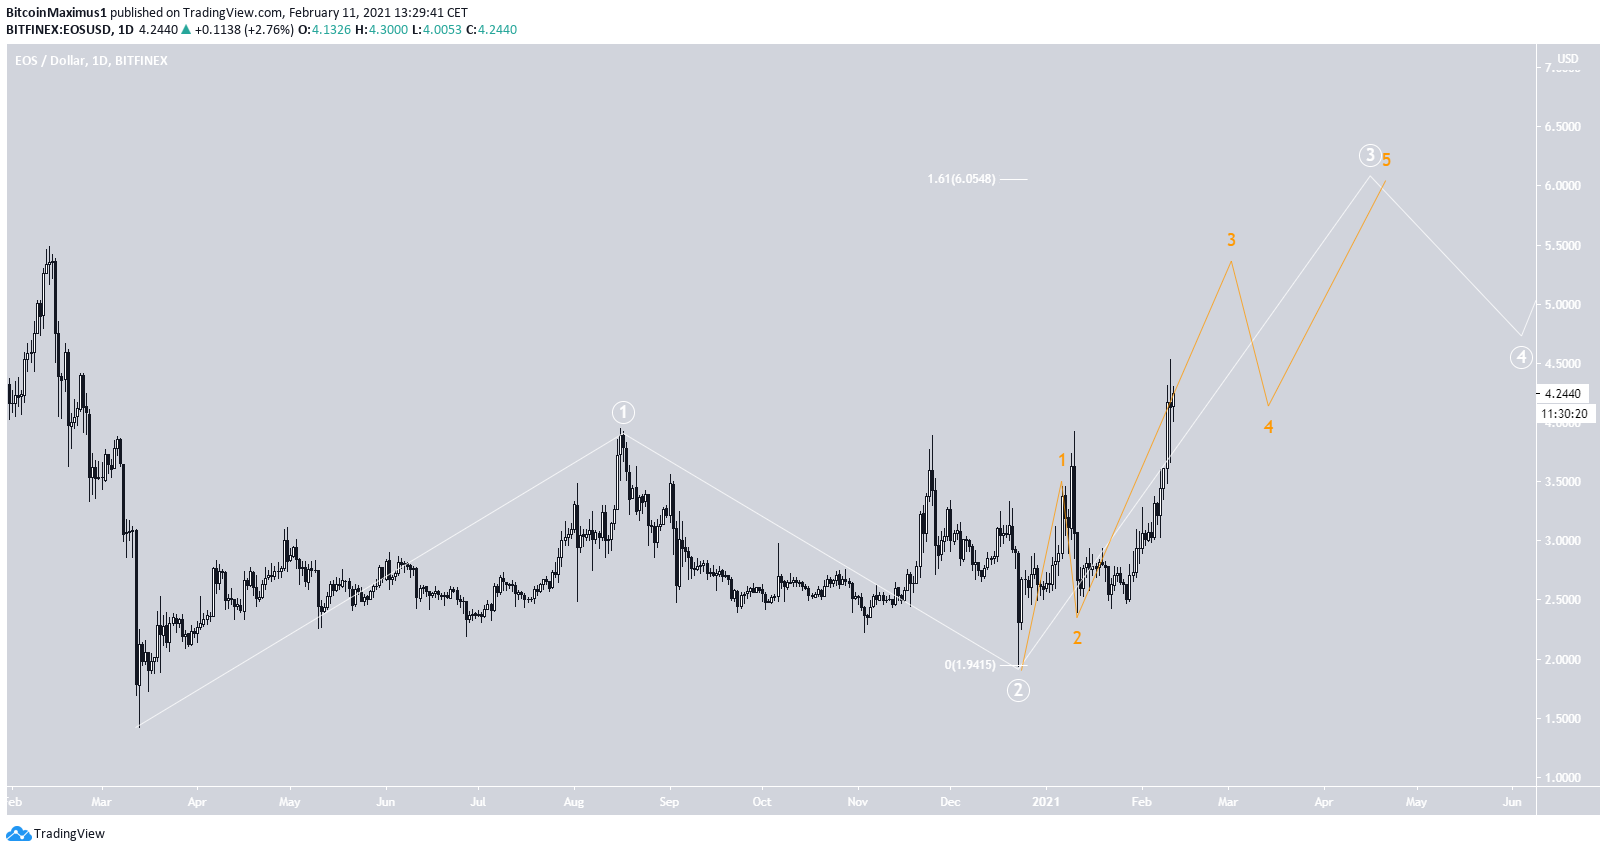
The wave count suggests that EOS is in wave three of a bullish impulse which began with the March 2020 lows.
The sub-wave count is given in orange, indicating that EOS is in sub-wave three of the long-term wave three.
A likely target for the top of the movement is found near $6. This would give waves 1:3 a 1:1.61 ratio. In addition, it’s relatively close to the previously outlined $5.50 resistance area.
A decrease below the sub-wave one high at $3.45 would invalidate this particular wave count.
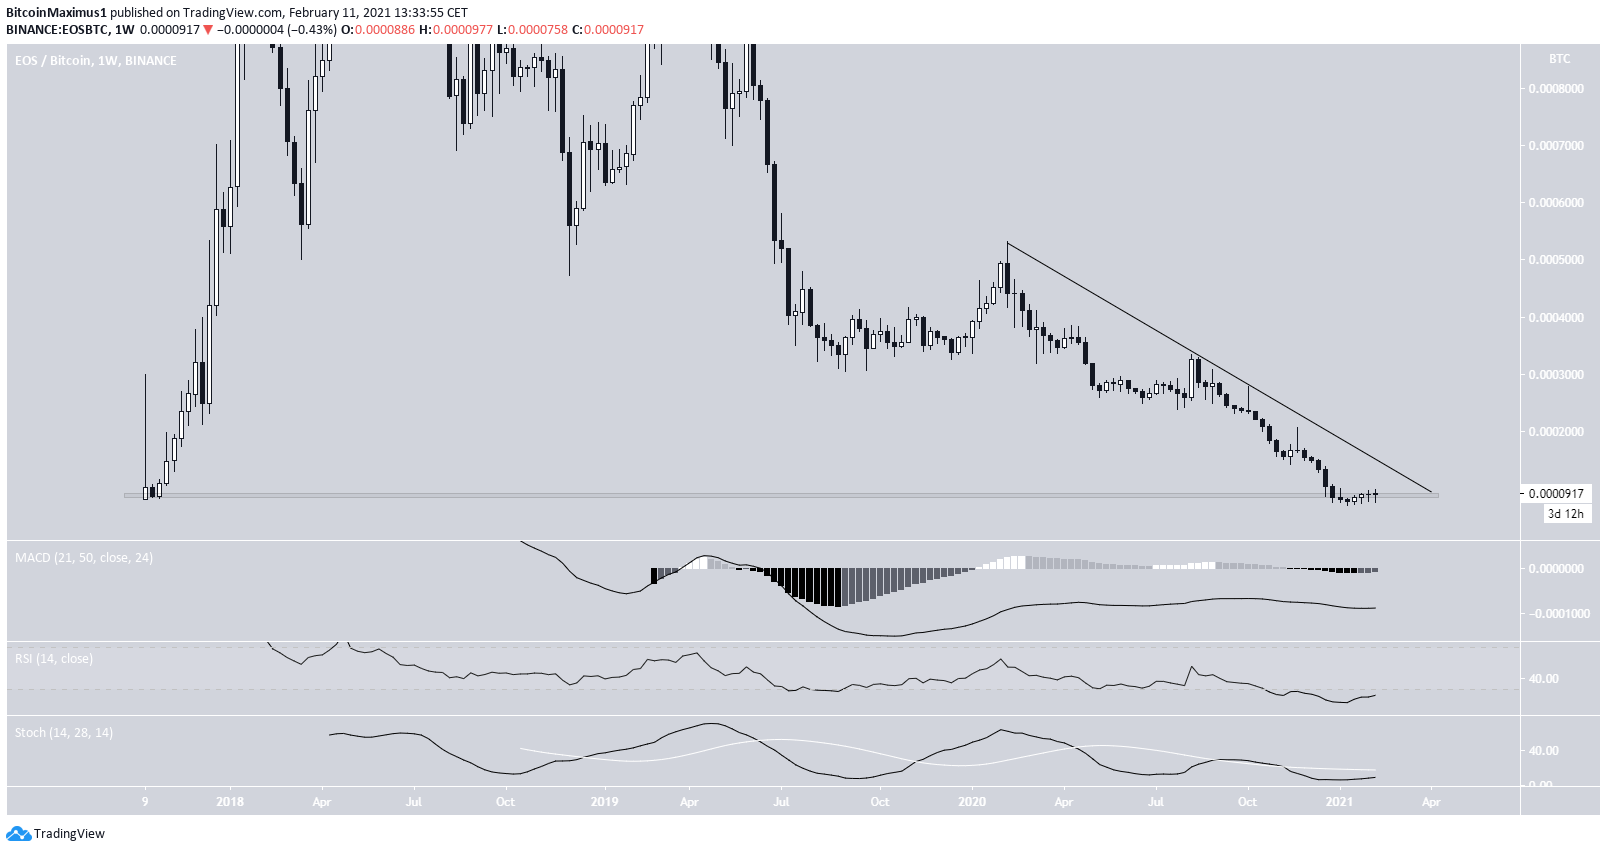
EOS/BTC
On Jan. 11, EOS/BTC reached an all-time low of 694 satoshis. Since then, it has moved slightly upwards but is still inside the all-time low support region of 800 satoshis. Furthermore, EOS/BTC is still following a descending resistance line.
Technical indicators have begun to show strength, but are not sufficient to predict a bullish trend reversal. Unless the Stochastic oscillator makes a bullish cross or the RSI crosses above 30, we cannot consider the trend bullish.
Conclusion
EOS/USD is expected to continue moving upwards towards the closest resistance areas at $5.50 and $7.65.
EOS/BTC is trading near an all-time low but has yet to confirm a bullish trend reversal.