
ICX coin price fails to surpass the 200-day EMA resulting in the sellers taking control and risking the fallout of $1. Should you sell before fallout? Key technical points:
- ICX prices have decreased 6.25% in the past 24 hours.
- The 200-day EMA rejects the bullish rally.
- Finally, the 24-hour trading volume of Icon is $32.75 Million, marking a 60% fall.
Past Performance of ICX
ICX coin price started a phenomenal bullish rally with the demand surging at the 50-day EMA. The coin price surpassed the $1 mark and the 100-day EMA with the 40% rally last fortnight. However, the buying spree failed to surpass the 200-day EMA resulting in the retracement to the psychological barrier of $1. 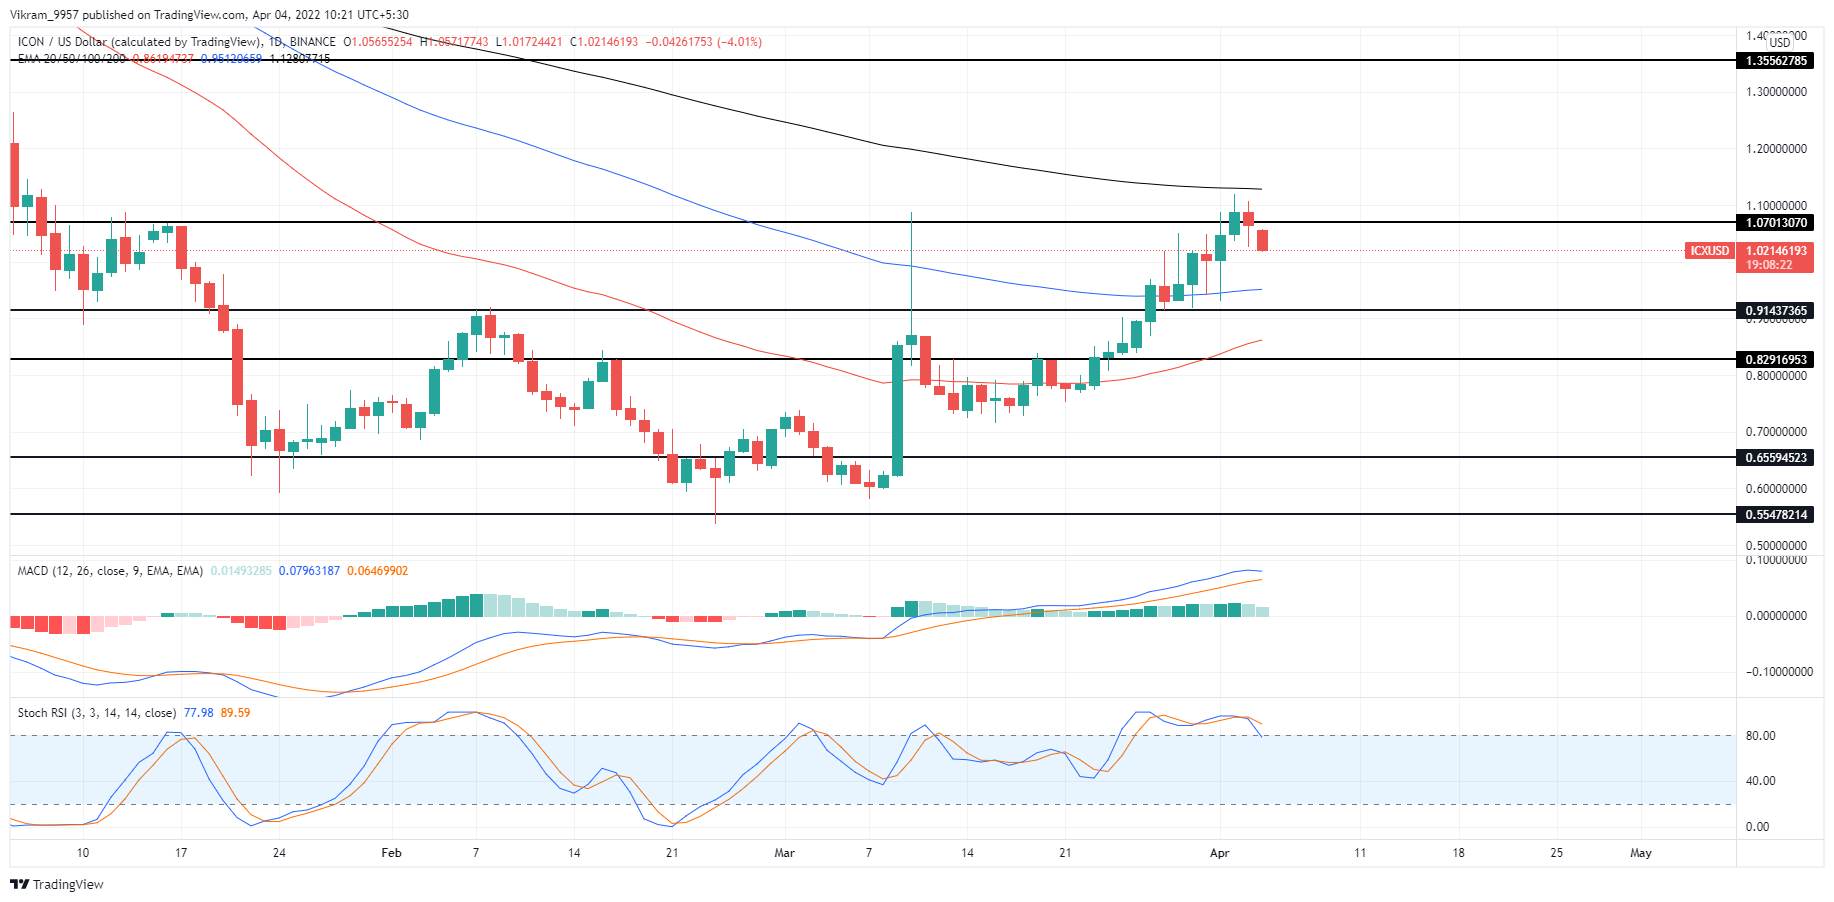 Source-Tradingview
ICX Technical Analysis
ICX coin price action forms bearish engulfing candlesticks, undermining the lower price rejection that met near the 100-day EMA. Hence, the fallout of $1 seems imminent and teases a selling opportunity. The crucial daily EMAs (50, 100, and 200-days) maintain a bearish alignment and significant spread among the EMAs. Moreover, the rejection from the 200-day EMA might shortly test the 100-day EMA. Stochastic RSI Indicator: The Stochastic RSI shows the K and D line giving a bearish crossover in the overbought territory. Hence, the lines crossing below the 70% mark will generate a selling opportunity. MACD Indicator: The MACD and signal lines reflect a decline in the bullish spread and increase the chances of bearish crossover. Therefore, the indicator is on the verge of giving a selling signal. The ICX technical analysis reflects a high likelihood of a freefall below the $1 mark.
Upcoming Trend
The ICX/USD technical chart signifies the selling opportunities as the bears overtake trend control. The breakout of the $1 support level will result in a downtrend that may test the 100-day EMA. Support Levels: $1 and $0.91 Resistance Levels: $1.26 and $1.6