
More activity and realization of prospects. Such remarks are probably made by investors to this cryptocurrency. The fact is that the XEM price began a downward trend even before it became mainstream in November. Beginning in September 2021, buyers stopped updating local highs and formed a clear fall channel. As a result, sellers were able to test the range of $0.09. This range is the main hope of buyers to stop the trend of decline and likely reversal in the market. It is from this range that buyers have been able to raise the XEM price by 170% since June 2021. But, analyzing the movement of the XEM price in the range of $0.09 now it seems that the price is no longer interesting to investors. Starting from the trading week on 17 January, the XEM price is moving in this range. If in June 2021 we saw a sharp buyout and an aggressive reversal - now we see a passive consolidation near the range. 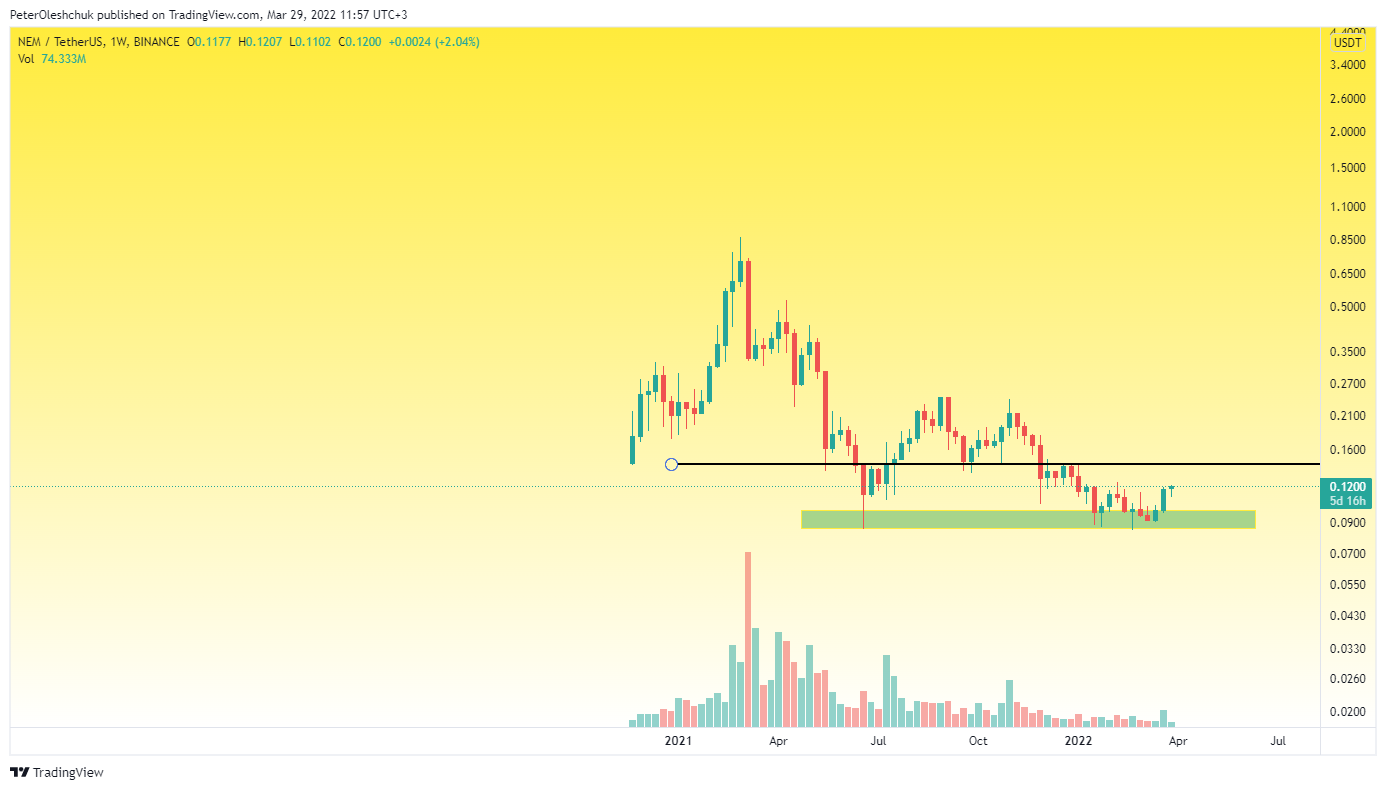 https://www.tradingview.com/x/QzQnraJJ/ In addition, the trading volumes during the $0.09 test is not increased and is just as low. This fact directly indicates the absence of an aggressive buyer. Of course, there is a high probability that after a long-term consolidation in the range of $0.09-$0.14, buyers will gain strength and start a new growth wave. However, even in this case, the main target, where it would be good to fix their long positions is at $0.22. Until the situation with trading volumes in the XEM market changes and volatility increases, it is not time to talk about the scenario of updating the historical high.
Technical Analysis Of XEM On The Daily Timeframe
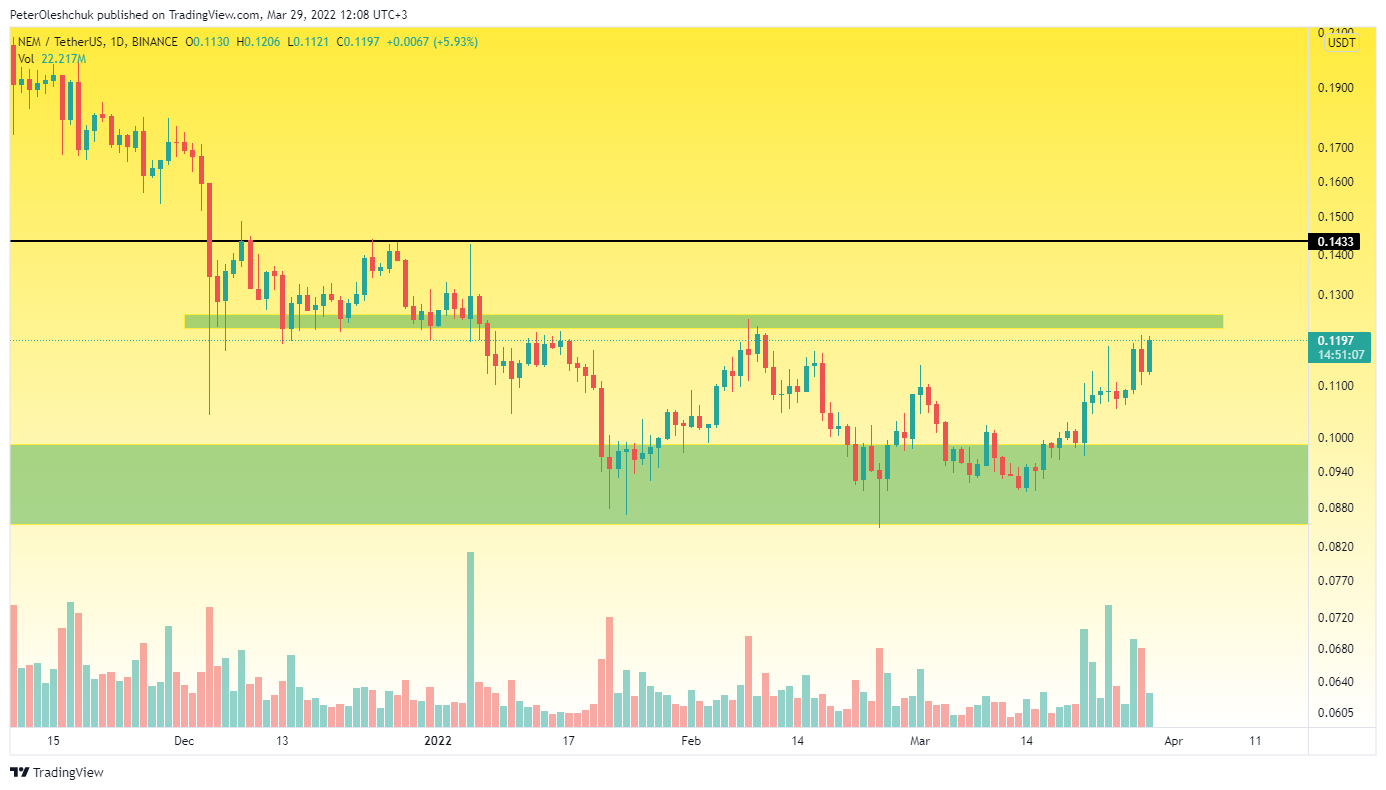 https://www.tradingview.com/x/2Vm285qH/ The sun's rays break through the darkness of the global picture in the daily timeframe. Analyzing the chart, we can see that since 21 March, the trading volumes in the XEM market have increased. If you compare them with the trading volumes during the trend growth, they are still small. However, compared to consolidation, we can say that local interest in the market has emerged. Now, the XEM price is close to the $0.125 local mark test. If buyers are unable to take control of this local mark in the coming days, it will mean their complete weakness at local lows. And this fact can indicate only one thing - the fall wave is not over. Only after the $0.14 test can you change the probability of continuing to fall from high to low. If local buyers allow XEM prices to fall below $0.1, the initiative will be lost and it is worth considering whether to keep this cryptocurrency.
The XEMBTC Price - Buyers Have Lost An Important Level Of Support
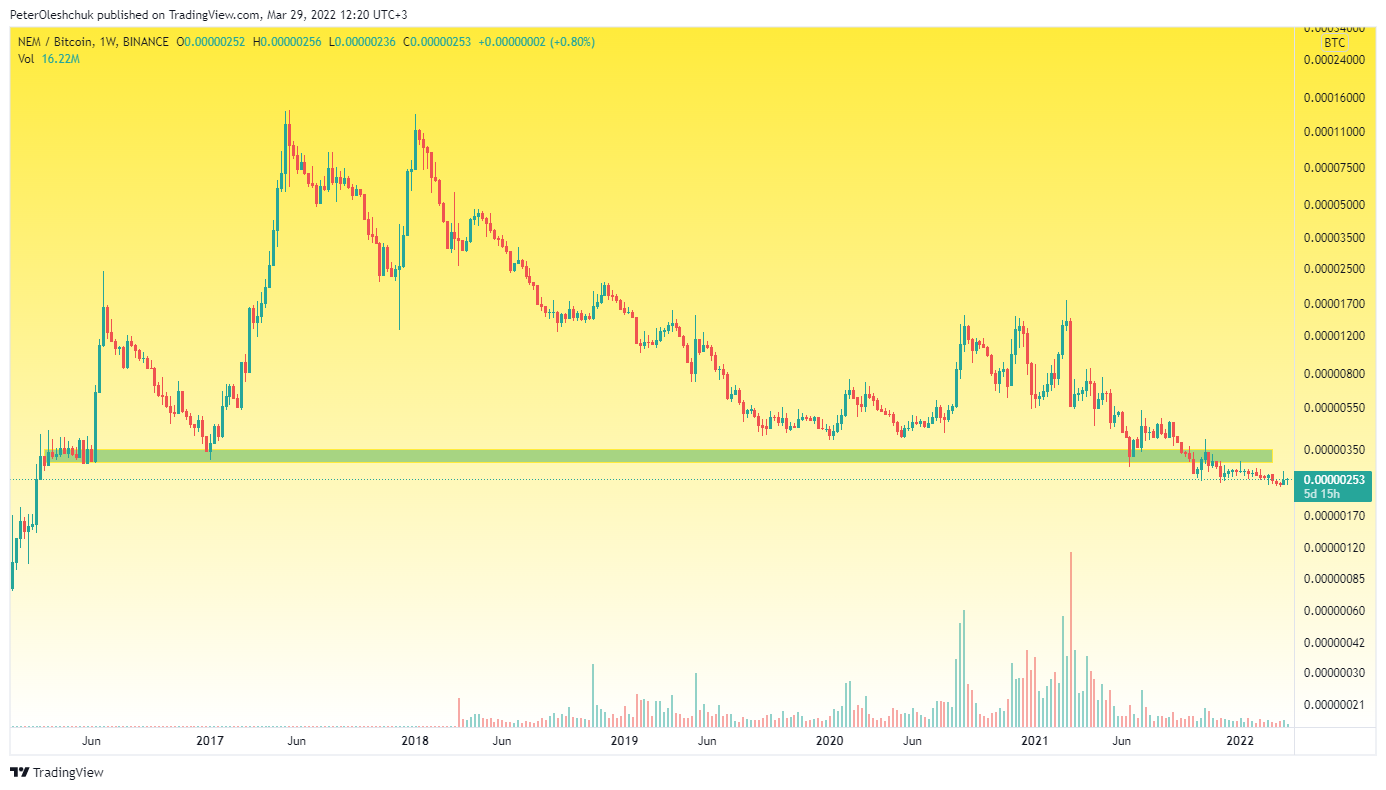 https://www.tradingview.com/x/L0Ta3gNR/ Even powerful liquidity zones are not yet able to stop the inexplicable fall of the XEMBTC price. Although the aggressive drain of cryptocurrency is not visible, sellers are able to systematically lower the price. All this is happening at a low, which indicates a lack of interest from a large buyer. Until buyers take control of the range 0.00000320 - it is dangerous to buy this cryptocurrency. But, given the nature of the XEMBTC price movement on weekly timeframes, the best thing to expect is a global consolidation.