The Monero (XMR) price has finally moved above the $133 resistance area, something it had been struggling to do for the entire month of November.
Monero is expected to continue moving upwards and will likely accelerate once it’s able to move out from the short-term trading pattern outlined below.
Monero Long-Term Levels
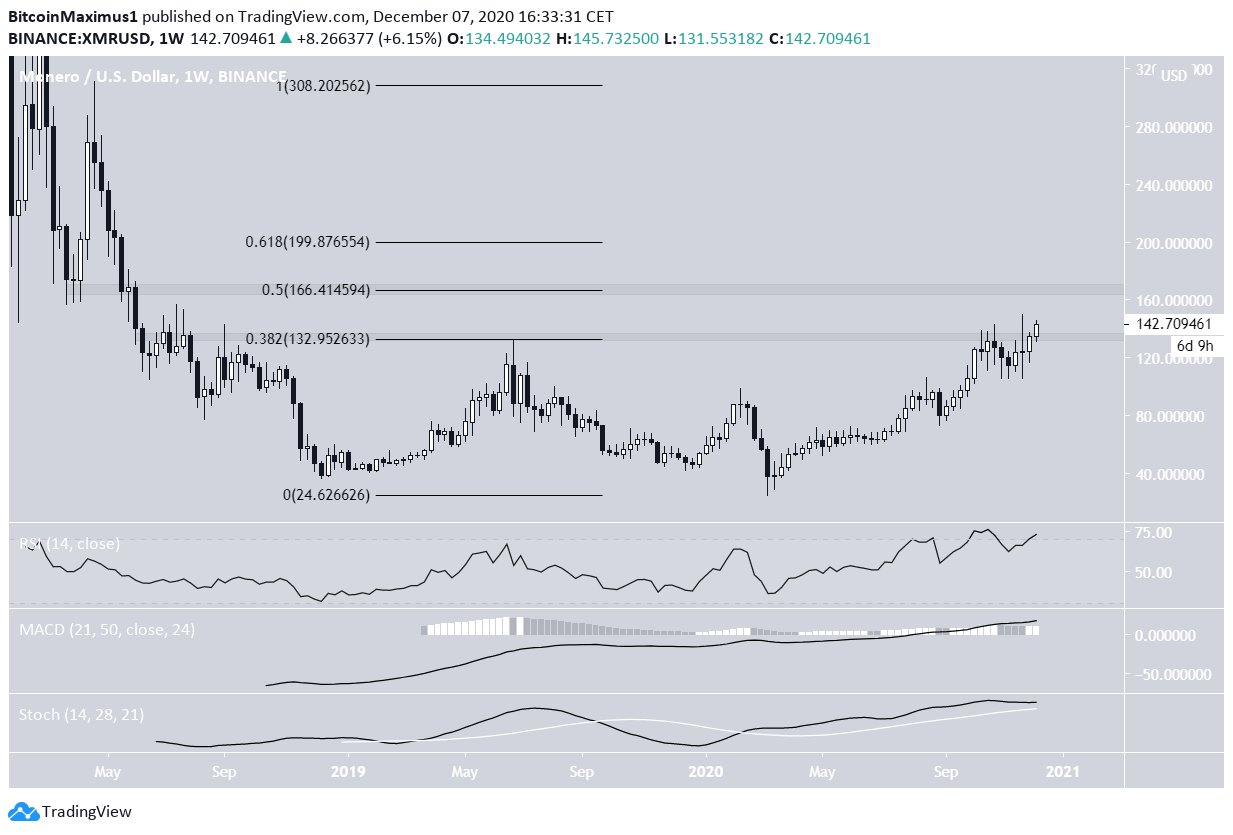
Since the end of October, the XMR price has been struggling to move above the $133 resistance area, which is also the 0.382 Fib retracement level of the entire previous downward move.
However, XMR is currently in the process of moving above this resistance area, targeting the 0.5 and 0.618 Fib retracement levels at $166 and $199 respectively.
Technical indicators are still bullish, despite an unconfirmed bearish divergence in the RSI, supporting the possibility of a continued increase.
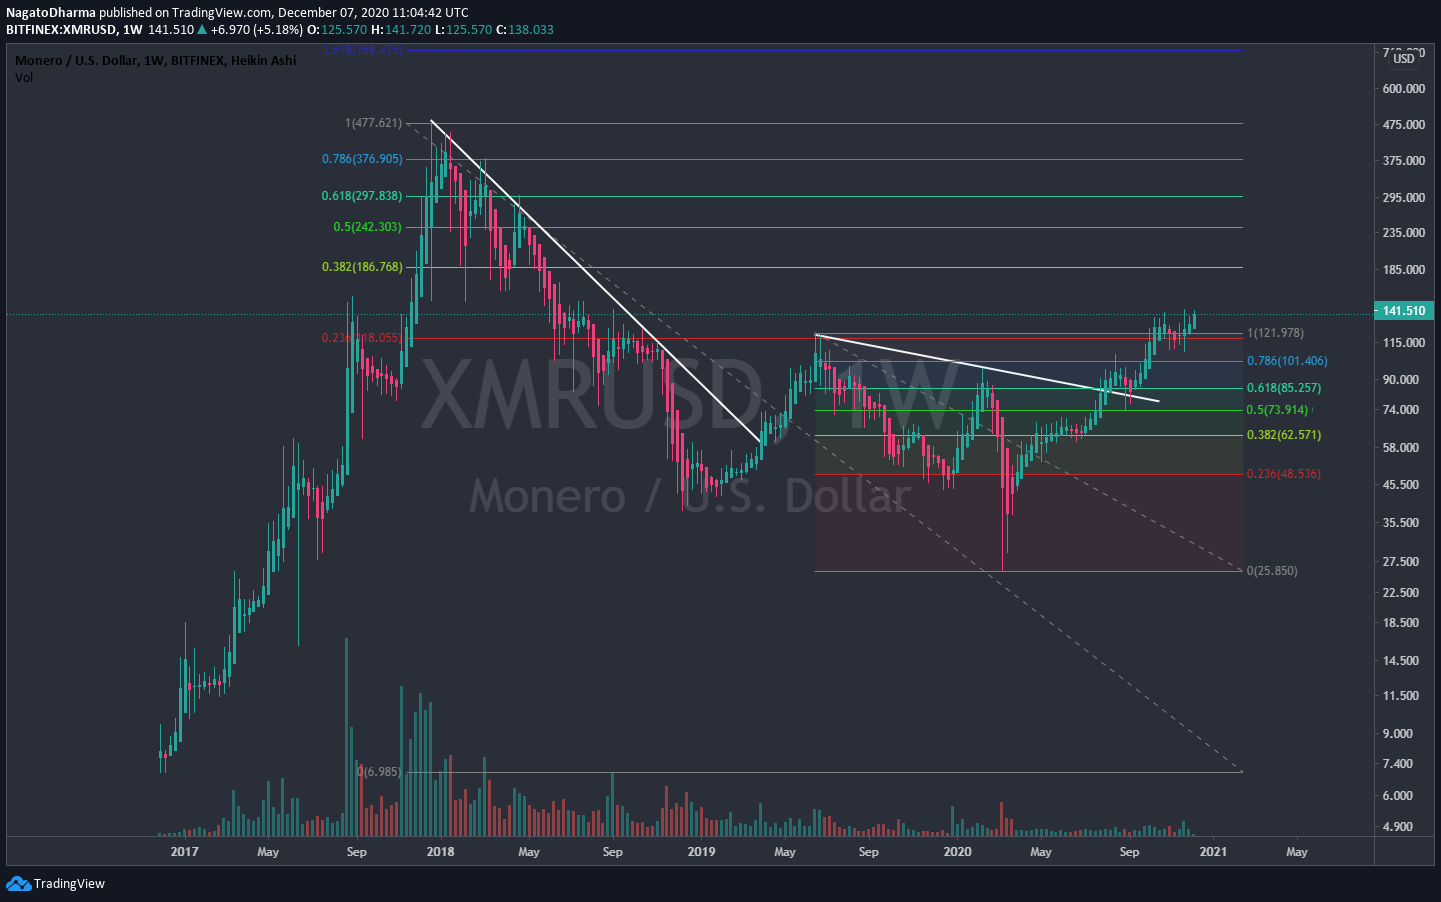
Cryptocurrency trader @Nagatodharma outlined a Monero chart, noting that XMR moved above an important long-term resistance area and is expected to continue moving upwards.
The weekly chart we outlined agrees with this assessment, indicating that XMR is now moving upwards towards $166 and possibly $199 after.
Short-Term Channel
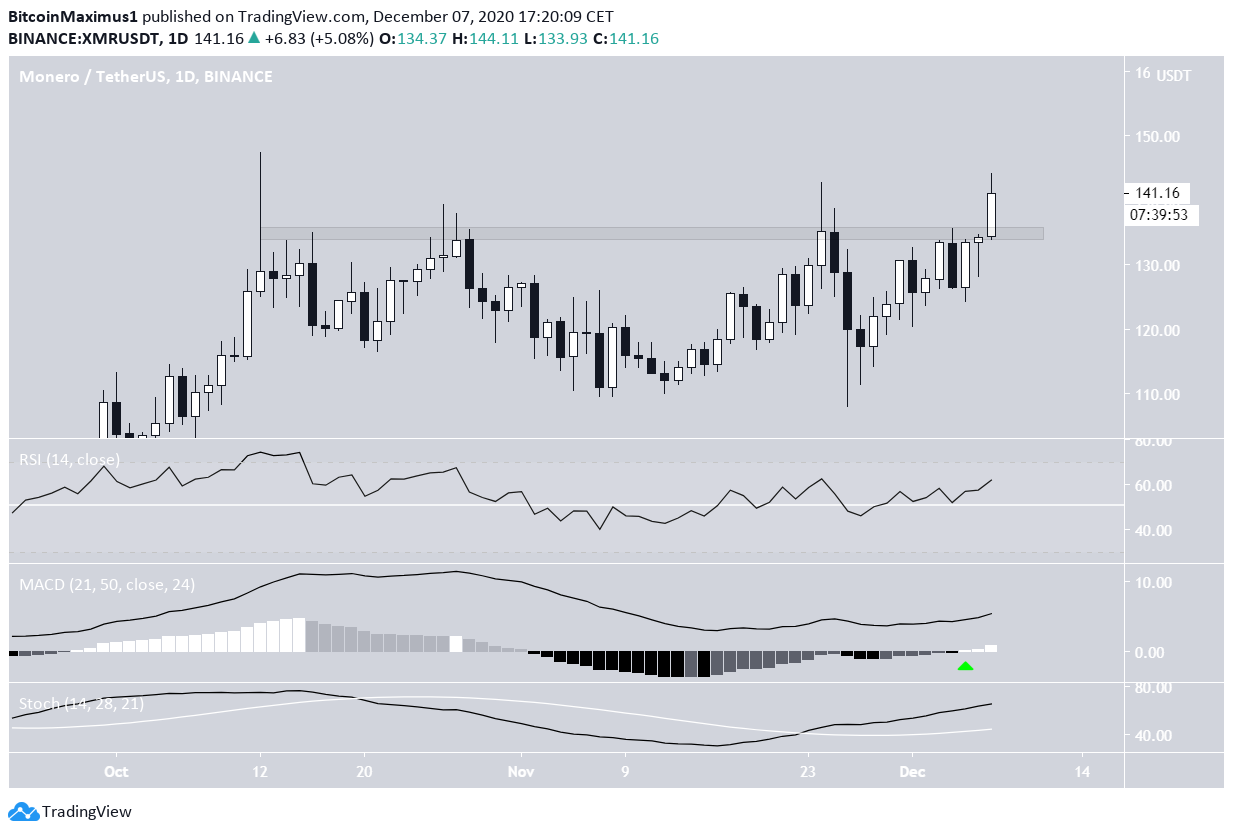
The daily XMR chart shows the breakout from the $133 resistance area more clearly.
XMR has clearly moved above this level and is in the process of reaching the highest daily close of the year, which is also the first close above this area since 2018.
The MACD, RSI, and Stochastic oscillator are increasing and none have generated bearish divergences, a sign that the breakout is legitimate.
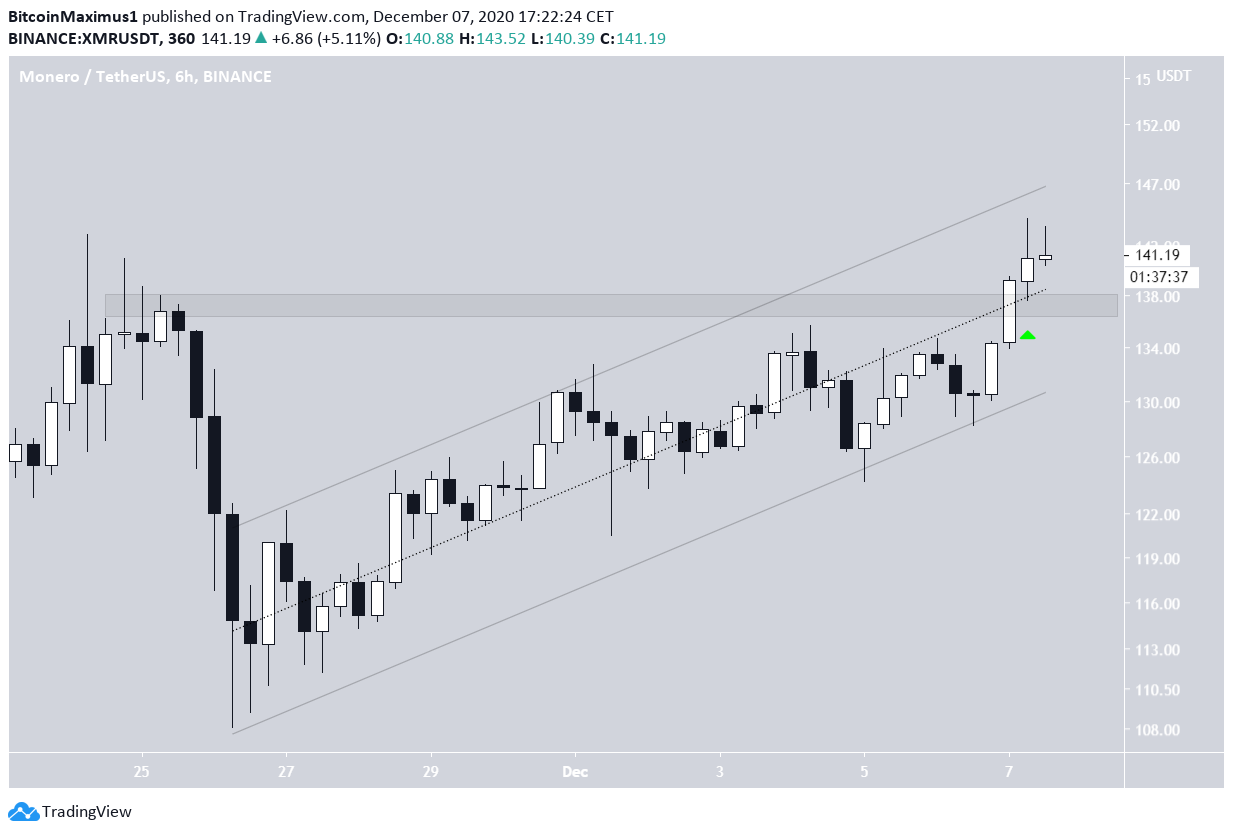
A look at the six-hour time-frame reveals that XMR is trading inside a parallel ascending channel.
Currently, XMR has moved above the middle of the channel and validated its midpoint (shown with the green arrow below) as resistance.
If XMR breaks out above the channel, it will likely move up quickly.
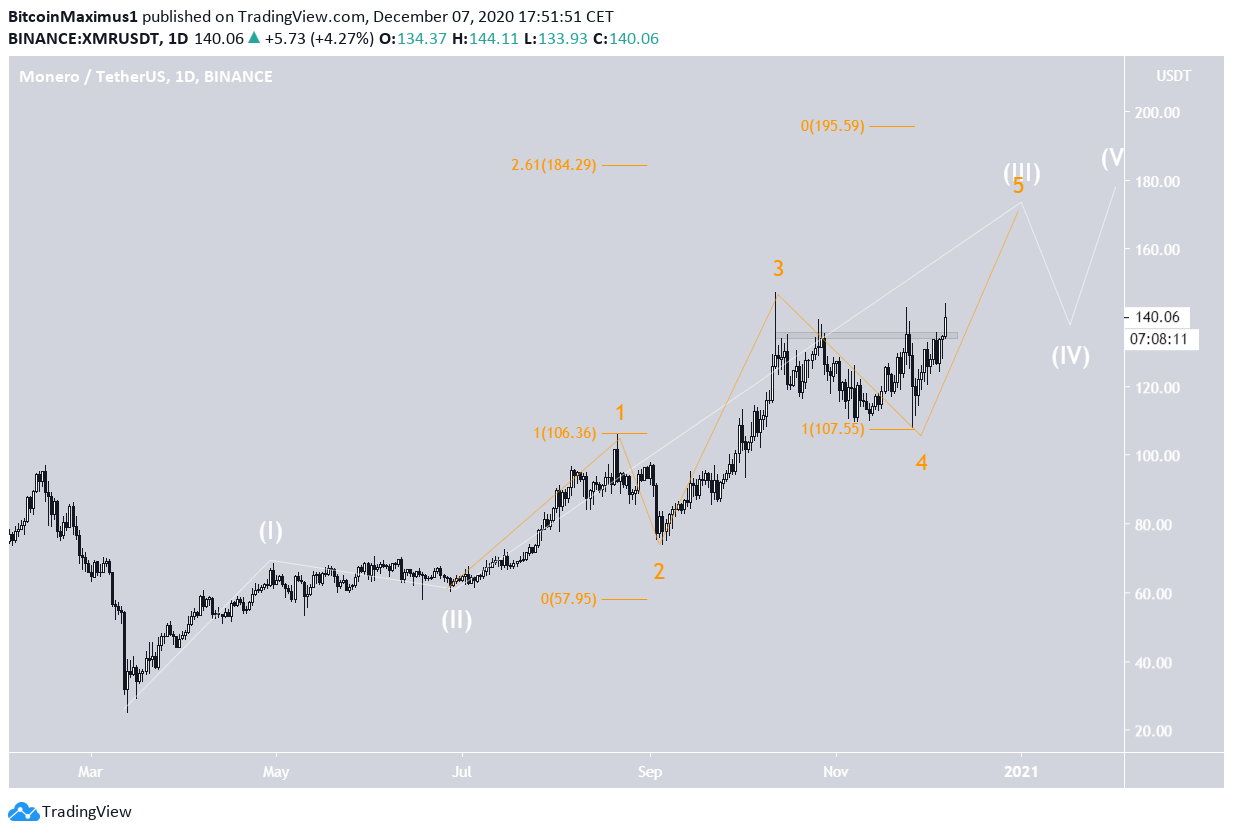
XMR Wave Count
The long-term count for XMR suggests that it began a bullish impulse (shown in white below) on March 13 and is currently in an extended wave 3. The sub-wave count for this wave 3 is given in orange, with XMR currently being in sub-wave 5.
A likely target for the top of the move is found between $184-$195. This range is the 2.61 Fib extension of sub-wave 1 and the length of waves 1-3 projected to the bottom of wave 4.
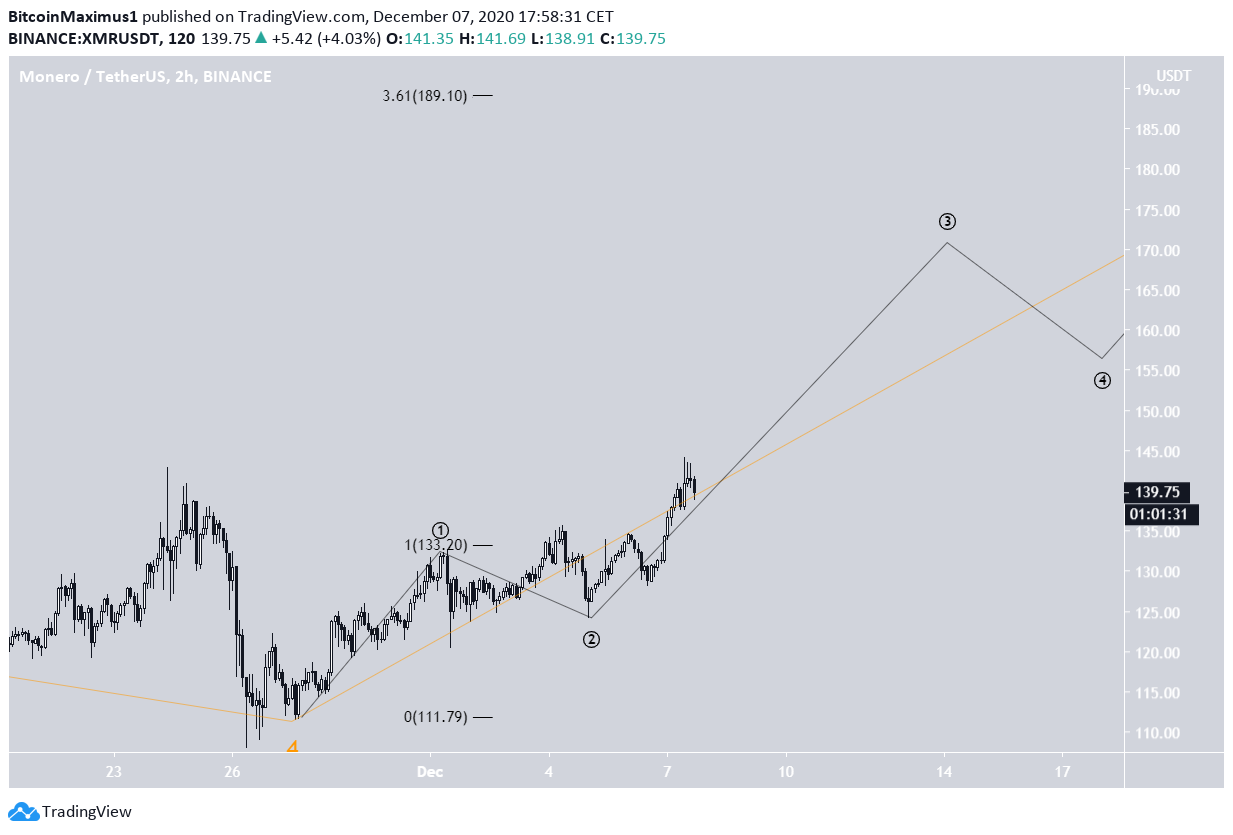
A closer look at sub-wave 5 shows that XMR has possibly just begun minor sub-wave 3, which is often the longest and steepest.
This also fits with the potential channel breakout scenario.
Conclusion
The XMR price is expected to continue increasing and reach a high between $185-$199. The rate of increase is likely to accelerate if XMR can break out from its short-term parallel channel.
Disclaimer: Cryptocurrency trading carries a high level of risk and may not be suitable for all investors. The views expressed in this article do not reflect those of BeInCrypto.