
XEM coin price shows increased buying activity resulting in the resistance trendline breakout. Will the breakout rally reach the $0.15 mark? Key technical points:
- XEM coin price outperforms the 50-day EMA.
- In addition, the altcoin price surpasses the $0.10 mark.
- Finally, the 24-hour trading volume of NEM is $71 Million, marking a 273% rise.
Past Performance of XEM
The XEM coin price displays an impulsive boost in buying pressure near the support level of $0.090. The recovery cracks above the $0.10 mark, the 50-day EMA, and the long-coming resistance trendline with an 18% jump last week. The trendline breakout comes with the bullish engulfing candlestick of 7.80% and shows a retest candle in action. 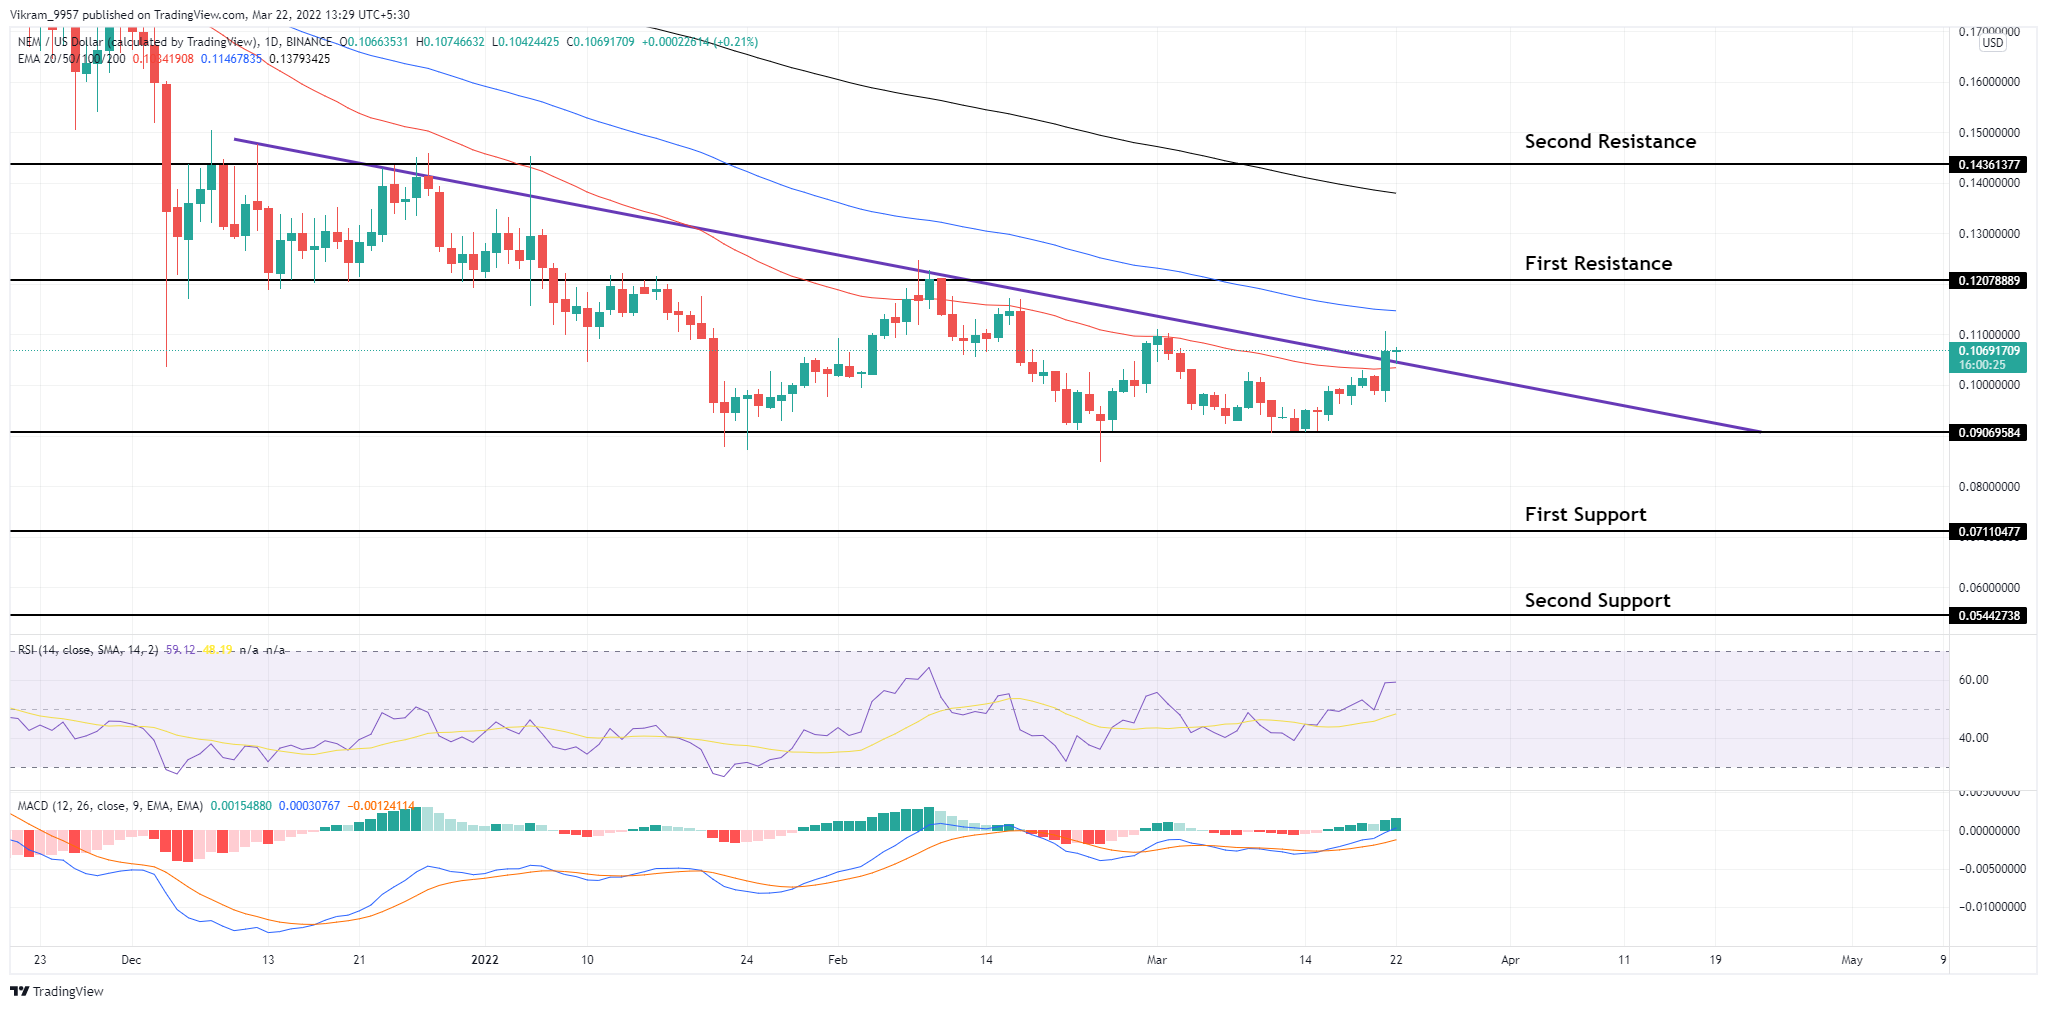 Source-Tradingview
XEM Technical Analysis
XEM coin price shows a high possibility of a post-retest uptrend continuation which may reach the $0.12 or $0.15 mark. Moreover, the increased buying pressure evident by the 270% jump in trading volume increases the chances of a bull run. The crucial EMAs (50, 100, and 200) sustain the bearish alignment as buyers transcend the 50-day EMA and prepare to head higher after retest. However, the 50-day EMA breakout teases a bull run to the 200-day EMA, accounting for an almost 30% price jump. RSI Indicator: The RSI slope continues the spiked bullish movement as it surpasses the halfway mark and approaches the overbought boundary. Furthermore, the bullish divergence is clear and teases a bullish continuation. MACD Indicator: The MACD and signal lines regain the positive alignment with the bullish spread, and the strings continue to approach the halfway mark. In a nutshell, the XEM technical analysis shows a boom in underlying bullishness and teases a bull run to the $0.15 mark.
Upcoming Trend
XEM coin price shows an ongoing retest phase of the trendline breakout, which may shortly push higher to the 100-day EMA. However, the uptrend has the potential to surpass the 200-day EMA and hit the $0.15 mark as the buyers add up. Contrarily, a failed retest will lead to the $0.10 fallout and a price fall to $0.090, accounting for an almost 15% downfall. Support Levels: $0.10 and $0.090 Resistance Levels: $0.12 and $0.15