The Tomochain (TOMO) price has been increasing significantly since it reached a local low on Sept 5.
Despite the significant rejection on Oct 1, it’s possible that the correction has ended and TOMO has begun a new upward move.
TOMO Bounces at Support
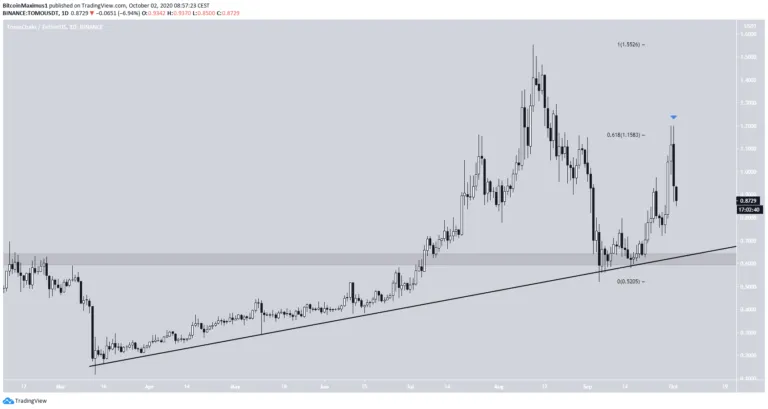
On Aug 13, the TOMO price reached a high of $1.55 and began a downward move that continued until a low of $0.52 was reached on Sept 5.
Since then, the price has been increasing at an accelerated rate, reaching a high of $1.20. However, TOMO dropped sharply on Oct 1 and is currently trading near $0.87.
The main support area is found just above $0.63, while the main resistance area is found at $1.15, the 0.618 Fib level of the previous decrease.
Double-Top Pattern
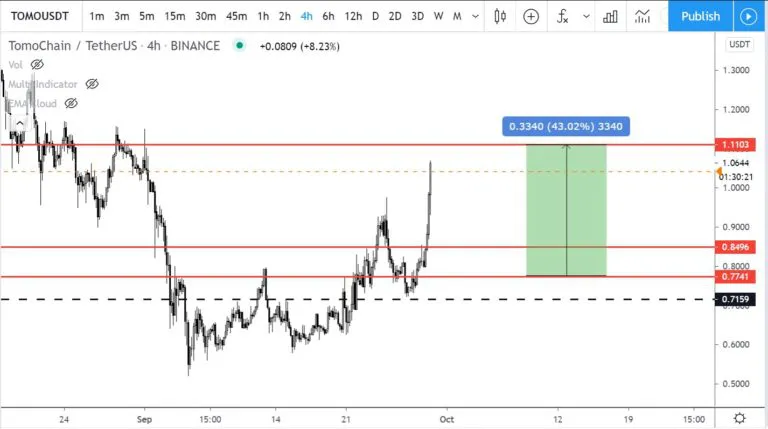
Cryptocurrency trader @Devchart outlined a TOMO chart, stating that the price has increased by 40% and almost reached his target resistance area of $1.11.
Since the Tweet, the target has been hit, but a rejection followed.
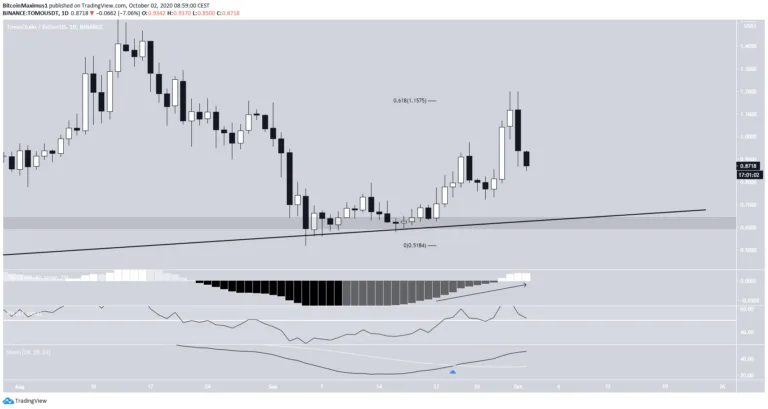
In the daily time-frame, technical indicators are bullish. The MACD, RSI, and Stochastic Oscillator are all increasing. The former has crossed into positive territory and the latter has made a bullish cross.
In addition, the RSI has not reached overbought territory nor has it generated any bearish divergence.
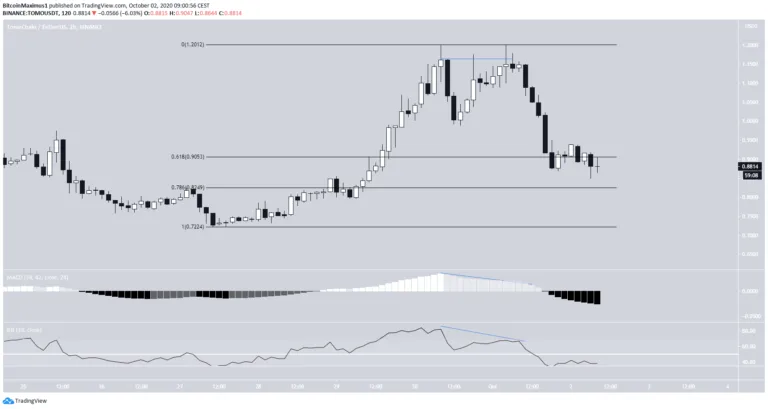
The shorter-term 2-hour chart shows a double-top pattern, which has been combined with bearish divergence in both the RSI and MACD.
The double-top caused a strong rejection which took the price downwards to the 0.618-0.786 Fib levels at $0.82-$0.90, where it is currently trading.
Wave Count
Since the aforementioned Aug 13 high, TOMO seems to have completed an A-B-C correction (in orange below), in which the A:C waves have a 1:1 ratio.
Since then, the price has been rapidly increasing in what looks like the beginning of an upward move.
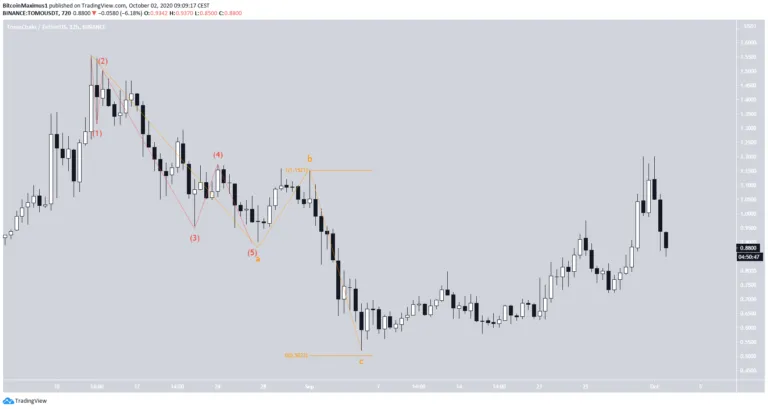
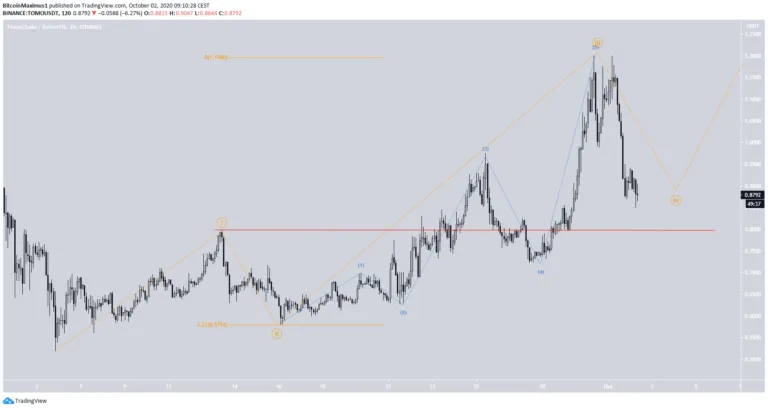
If the price has begun an upward move on Sept 5, it has just completed the extended third wave (orange, sub-waves in blue), and is currently correcting in what is likely wave 4.
The previously mentioned 0.5-0.618 Fib levels at $0.82-$0.90 present the most likely reversal area.
A decrease below the wave 1 high at $0.796 would invalidate this particular wave count.
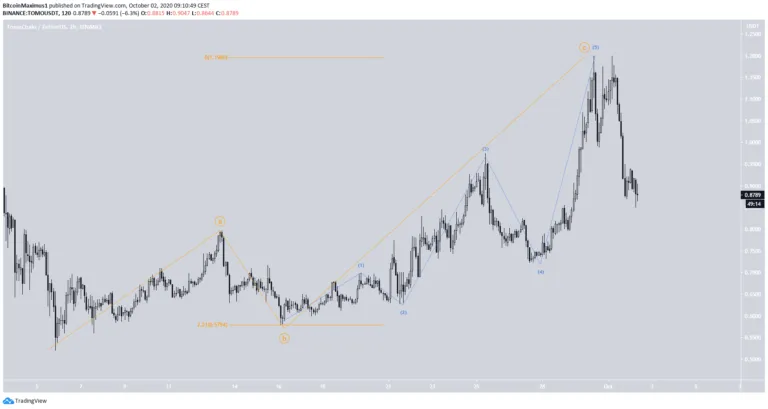
The alternate wave count sees the upward move as an A-B-C wave instead of the beginning of an impulse. The fact that both wave 3 and wave C are comprised of the same wave count (blue) makes it difficult to invalidate one or the other.
However, the fact that the A:C waves have a 1:2.21 ratio makes the formation slightly unusual, suggesting that the previously outlined bullish count has a higher chance to be correct.
To conclude, it is possible that TOMO has begun a new upward move, and will continue moving upwards after completing the current short-term correction.