- Downtrend lowers coin value to $113.7.
- Resistance for AAVE is present at $130.1.
- Support is present at the $110.3 level.
The Aave price analysis indicates a decline in price in the last hour. The price levels have moved down to meet the $113.7 level, which is a quite negative situation for the coin as this is the lowest after 11th January 2021. Furthermore, there have been ongoing variations in today’s price trend that have lasted for a while, and the bears have finally secured their lead once again.
The bears are inclined towards taking the price further below the current price value to keep maintaining their bearish slide that has been continuing for the past few hours. The bears have played swiftly as they have dodged past the bullish momentum that had interrupted their streak.
AAVE/USD 1-day price chart: Bearish trend aggravates as price experiences downfall to $113.7
The 1-day price chart showing Aave price analysis is going in favor of the bears once again, as they have regained their momentum after a negligible bullish activity of 5th March.
The price value has gone through a major decline as today it has reached the value at $113.7. This is really discouraging for the buyers who are trying to support the price function and enhance the cryptocurrency value.
Meanwhile, if we talk about the moving average value in the 1-day chart, then it is found resting at $129.7 level. Moreover, the SMA 20 curve is below the SMA 50 curve, which can be taken as a bearish sign as well, as the short-term trending line is going downwards.
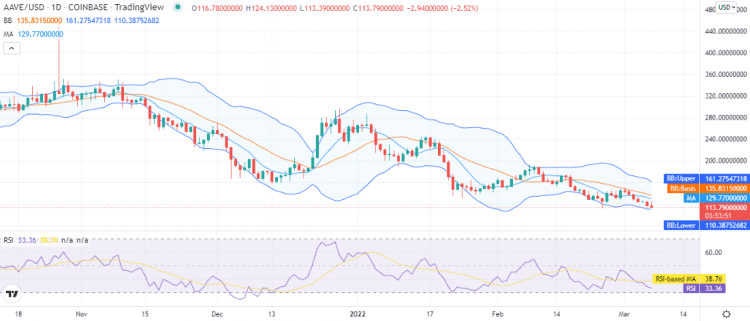
The volatility is high at a massive scale, which can be a positive indication for the future of cryptocurrency. As we know, the Bollinger bands indicators also hold vital importance in informing us about the current market trends. Its upper band is showing the value at $161.2 while its lower band is showing $110.3, representing the resistance and support, respectively.
The Relative Strength Index (RSI) score has also followed a sharp dip, as it has reached down near the undersold mark and is trading at index 33.
Aave price analysis: Recent developments and further technical analysis
The 4-hours Aave price analysis indicates that the bearish momentum has resulted in a further decline in the price value. The price has dropped to $113.7 after overcoming the advancements coming from the bullish side. As bulls also showed good performance during the day but eventually, bears outperformed them.
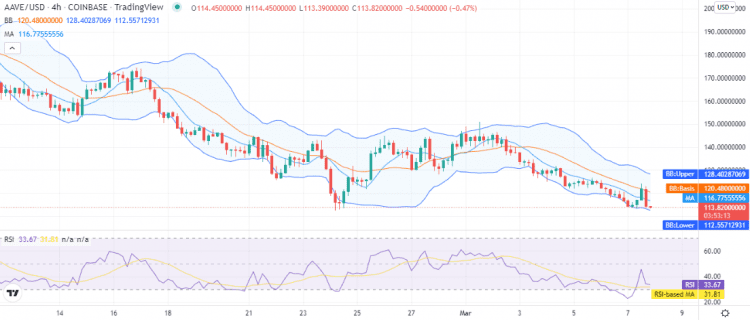
The bearish momentum is to intensify in the upcoming hours, as the moving average (MA) is also at a greater height as compared to the current price, i.e., $116.7. Also, the Bollinger bands values in the 4-hours price chart are as follows; the upper Bollinger band is at $128.4, whereas the lower Bollinger band is at $112.5, respectively.
The volatility is gradually increasing, and the RSI score has faced decline as well because of the ongoing bearish trend and has lowered to index 33.
Aave price analysis conclusion
The Aave price analysis predicts that the past week has seen a building pressure from the bearish side, which had resulted in a decrease in Aave/USD price value. Yet, today the bears have been able to rise once again to prevent the bearish streak from breaking.
The price levels have lowered to $113.7, as more sellers have entered the market as compared to the buyers. If the bulls are able to find a chance of improving the price values, then the coin might get support at a $110 support handle.
Disclaimer. The information provided is not trading advice. Cryptopolitan.com holds no liability for any investments made based on the information provided on this page. We strongly recommend independent research and/or consultation with a qualified professional before making any investment decisions.