Hedera price extends 7-week slide as HBAR bears maintain control below $0.0645
ambcrypto.com
30 m
Hedera [$HBAR] has shed 3.79% in the past 24 hours, continuing its downtrend. In mid-October, the former support at $0.088 had been breached, setting off a steady wave of selling.
The past week’s market-wide volatility did not help $HBAR bulls. At the time of writing, they were defending the $0.055 support zone.
In other news, it was reported that Canary Capital’s $HBAR spot ETF, the only U.S. spot ETF offering exposure to Hedera’s native token, now holds around 549 million $HBAR.
Know when your coins move
Alerts, real-time prices, and market news — all in one app
Point your phone camera to install
4.8 based on 40K reviews in the App Store and Google Play
That was around 1.3% of the 43 billion circulating supply. It is long-term bullish for tokens to be accumulated in regulated infrastructure. But is it enough to halt the dominant downtrend?
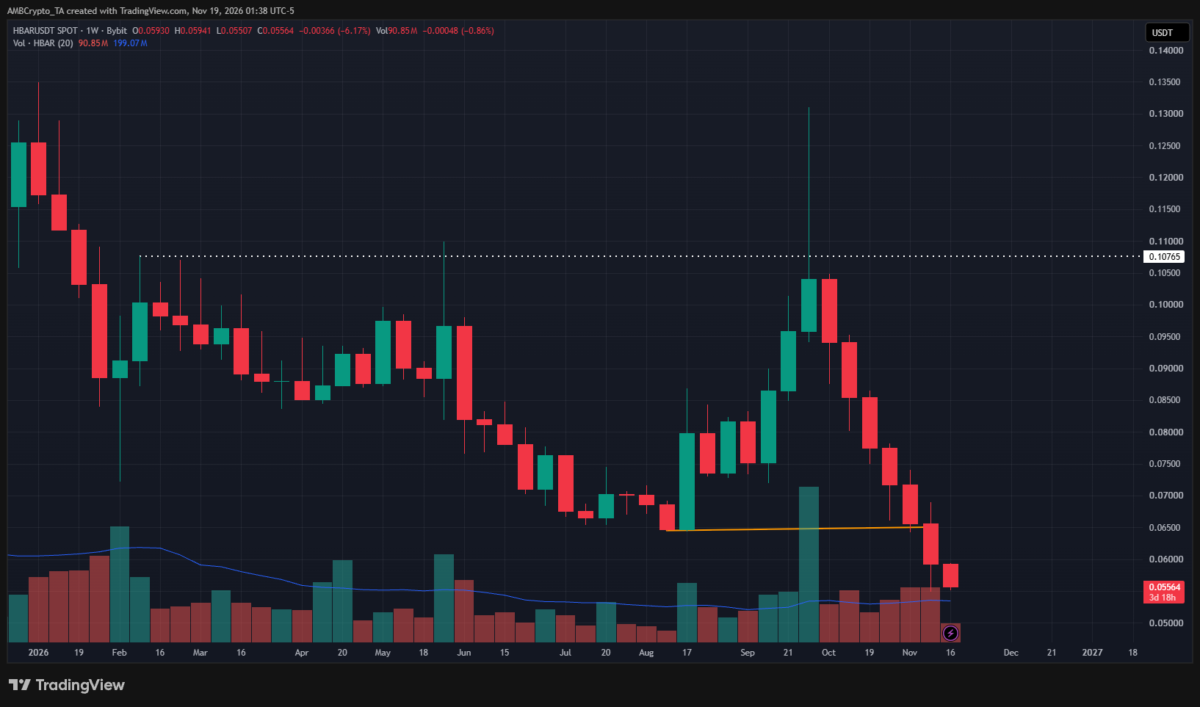
Nearly 2 months of red sees $HBAR fall to new lows
Source: $HBAR/$USDT on TradingView
Hedera’s weekly price chart showed that the bulls tried to push prices past the $0.107 swing level from February. They tried twice and failed twice, with the latest attempt coming in September.
Since this rejection, the price has closed a weekly session below the $0.0645 swing low. Moreover, the price action showed a bearish long-term trend continuation.
Besides, the $0.0575 level, which had been an important support from November 2024, has also been breached.
Long-term $HBAR investors might have to rethink their bullish bias following the steady losses and the altcoin’s inability to defend key demand zones.
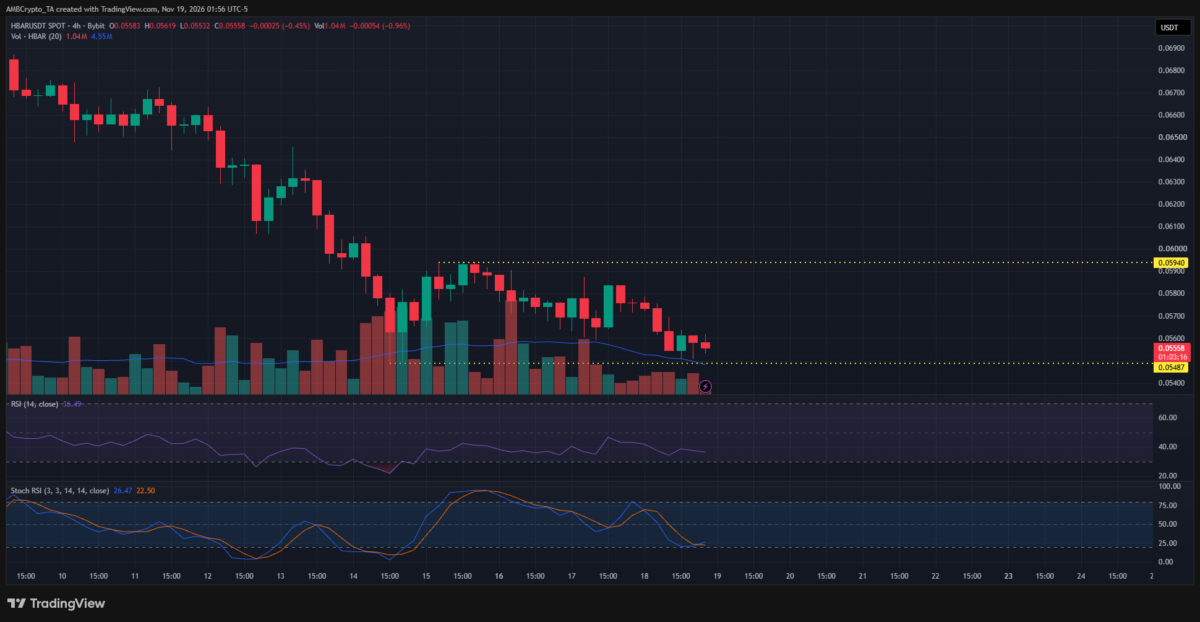
Should $HBAR traders sell the bounce?
Source: $HBAR/$USDT on TradingView
The 4-hour chart showed that the $0.059 and $0.054 were the key horizontal levels to watch. The RSI was still below neutral 50, showing bears continue to have the upper hand.
The Stochastic RSI was about to form a bullish crossover, which could be followed by a price bounce. Swing traders can look to sell this bounce, if one appears and gets close to $0.058-$0.059.
A breakdown below $0.0548 will confirm further bearishness. Meanwhile, a breakout past $0.0594 will signal some respite to the downtrend and possibly a bigger bounce.
Final Summary
Canary Capital held a sizeable amount of $HBAR, compared to the circulating supply in its spot ETF, which was a bullish sign.
Nevertheless, market-wide pessimism has resulted in 7 consecutive weekly bearish candles for the altcoin, confirming the long-term downtrend’s continuation.

 ambcrypto.com