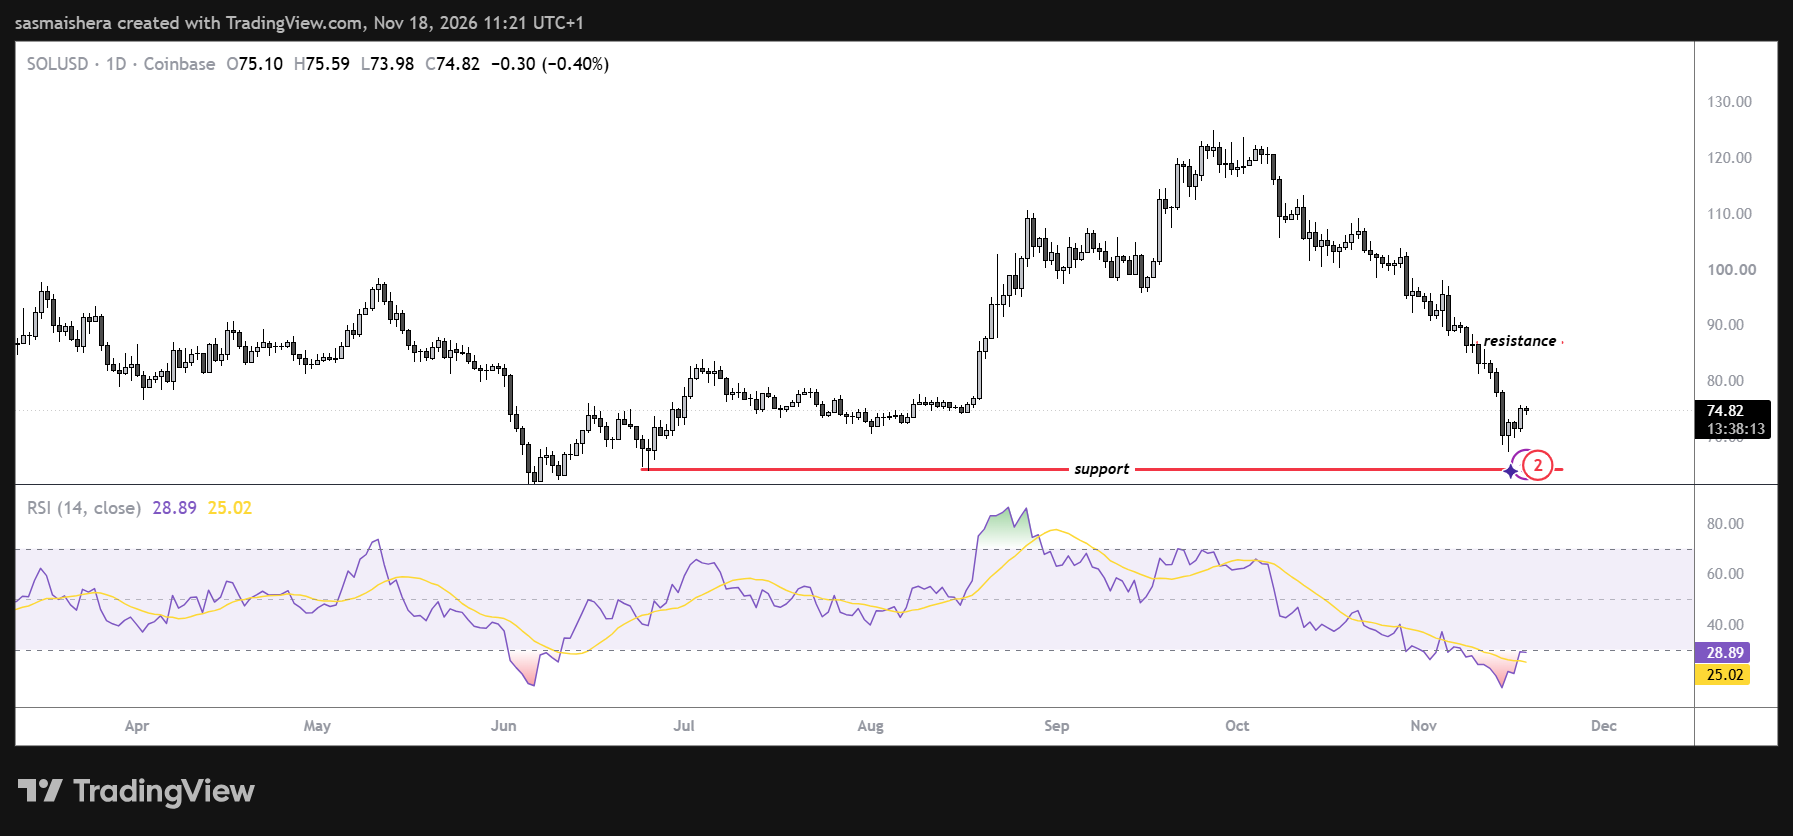
Solana ($SOL) extended its recovery on Wednesday, trading near $75 after gaining more than 3% in the last 24 hours as institutional demand showed tentative signs of improvement.
The rebound followed the first positive daily inflow into Solana exchange-traded funds (ETFs) in nearly four weeks, alongside stronger-than-expected quarterly earnings from Nvidia.
However, the recovery comes against a challenging market backdrop. Solana has recorded six consecutive weekly losses, while futures Open Interest has declined significantly as traders reduce their exposure.
Know when your coins move
Alerts, real-time prices, and market news — all in one app
Point your phone camera to install
4.8 based on 40K reviews in the App Store and Google Play
Technical indicators also present a mixed picture. Although oversold conditions suggest that selling pressure may be easing, $SOL remains below its major moving averages, leaving the broader downtrend intact.
Solana ETFs record first inflows since October 21
Institutional demand for Solana showed signs of improvement this week after several weeks of persistent withdrawals.
According to SoSoValue, US spot Solana ETFs recorded approximately $11.68 million in net inflows on Monday, marking their first positive daily flow since October 21.
The inflows coincided with $SOL's recovery, suggesting that some investors may be returning after the cryptocurrency's prolonged decline.
However, the improvement remains tentative. Solana ETFs recorded no net inflows on Tuesday, indicating that institutional buying has yet to establish a consistent trend.
If positive ETF flows continue, they could provide additional support for $SOL and help stabilize sentiment.
Solana's rebound also coincided with stronger-than-expected quarterly earnings from Nvidia. The semiconductor company reported third-quarter revenue of $115.8 billion, representing a 103% increase from the previous year and a 20% rise from the preceding quarter.
The results helped improve sentiment toward technology-related investments and other risk-sensitive assets.
Despite the recent price recovery, Solana's derivatives market continues to show signs of weakening activity.
According to CoinGlass, $SOL futures Open Interest declined to approximately 54.33 million $SOL from 62.79 million $SOL last week.
A decline generally indicates that traders are closing positions or that contracts are being liquidated faster than new positions are opened.
Solana recovers from $67.50 after six consecutive weekly losses
Solana's recent rebound follows an extended period of weakness. $SOL trades around $74.82 on Wednesday after recovering from the $67.50 support level tested on Sunday.
The cryptocurrency declined approximately 16% last week, recording its sixth consecutive bearish weekly close.
The prolonged downturn has pushed Solana significantly below its major daily Exponential Moving Averages (EMAs). The 50-day EMA stands near $93.11, while the 200-day EMA is positioned around $96.46.
Both indicators remain well above the current market price, reinforcing the broader bearish structure.
Solana's momentum indicators suggest that the recent decline may be becoming overstretched. The daily Relative Strength Index (RSI) stands near 25, placing $SOL in oversold territory.
An RSI reading below 30 generally indicates that selling pressure has been unusually strong relative to recent buying activity.
Meanwhile, the Moving Average Convergence Divergence (MACD) indicator remains negative, suggesting that bearish momentum continues to dominate.
The combination of an oversold RSI and moderating MACD weakness supports the possibility of a short-term rebound.
Solana faces several important technical barriers as buyers attempt to extend the current recovery.
The first significant resistance stands near $77.60. A sustained breakout above this level could encourage buyers to target the next horizontal resistance around $87.46.
Beyond $87.46, Solana faces a concentrated resistance region formed by its major daily moving averages and nearby horizontal levels.
$SOL/USD Daily Chart
The 50-day EMA at $93.11 represents an important technical hurdle, followed by horizontal resistance near $95.82 and the 200-day EMA around $96.46.
Reclaiming this resistance cluster would provide stronger evidence that bearish momentum is weakening.
On the downside, $67.50 remains the most important immediate support. A breakdown below this level would weaken the current rebound and expose Solana to further selling pressure.
The next significant downside target stands near $60.13. Buyers may attempt to defend this region, although a sustained break below it would increase concerns about a deeper correction.
For now, Solana's near-term outlook remains mixed, with oversold conditions supporting a possible rebound while the broader trend continues to favor sellers.
AI disclosure: AI tools assisted with research and drafting of this piece. An Invezz editor reviewed the facts, sources and wording before publication. Any opinions or analysis are Invezz’s, not those of an automated system.

 invezz.com