Will XRP price crash below $0.90 as whale selling pressure intensifies?
invezz.com
17 November 2026 12:49, UTC
$XRP remains under pressure on Tuesday despite adding 1% to its value as persistent selling activity and deteriorating market indicators continued to weigh on the cryptocurrency
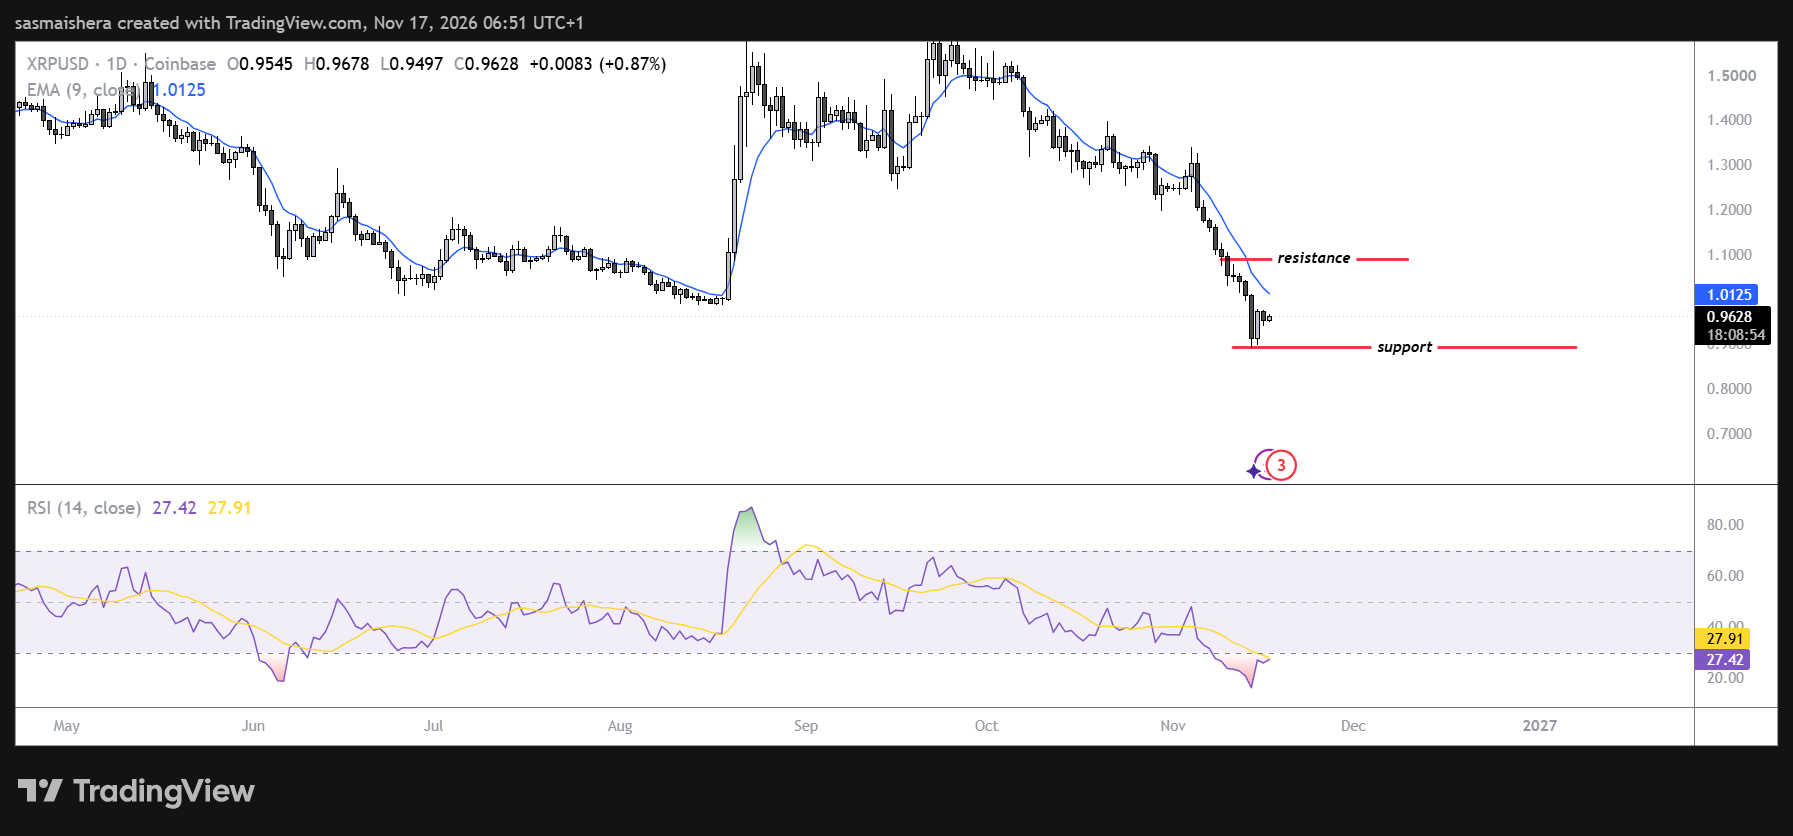
$XRP trades around $0.963 after falling to $0.893 on Saturday, revisiting price levels last seen in mid-November 2024.
According to CryptoQuant, $XRP is experiencing sell-side dominance, with large whale orders contributing to cautious market conditions.
Know when your coins move
Alerts, real-time prices, and market news — all in one app
Point your phone camera to install
4.8 based on 40K reviews in the App Store and Google Play
Technical indicators reinforce the bearish outlook for $XRP, which remains significantly below its major moving averages despite entering oversold territory.
$XRP faces growing whale selling pressure
On-chain and trading indicators suggest that large market participants remain active as $XRP extends its decline.
According to CryptoQuant's summary data, $XRP's spot and futures markets are experiencing large whale orders alongside sell-side dominance.
Both markets are also showing elevated trading conditions, indicating heightened activity during the ongoing correction.
The combination of large orders and aggressive selling suggests that market participants remain cautious about $XRP's near-term prospects.
Whale activity can influence cryptocurrency prices, particularly during periods of reduced liquidity or heightened volatility.
CryptoQuant's indicators suggest that selling activity continues to outweigh buying demand in $XRP's spot and derivatives markets.
$XRP revisits November 2024 levels after falling to $0.893
$XRP's latest correction has erased a substantial portion of the gains accumulated since November 2024. The cryptocurrency fell to $0.893 on Saturday before recovering modestly to trade around $0.963 on Tuesday.
The decline brought $XRP back to price levels last seen in mid-November 2024, indicating the extent of the recent downturn.
Despite the slight recovery from its weekend low, $XRP remains under considerable technical pressure. The cryptocurrency continues to trade below its major daily Exponential Moving Averages. The 50-day EMA stands around $1.217, while the 100-day EMA is positioned near $1.261.
Meanwhile, the 200-day EMA sits at approximately $1.325. These moving averages form significant resistance above the current market price, reinforcing the bearish near-term structure.
Trading below all three indicators suggests that sellers remain in control across multiple timeframes. The distance between $XRP's current price and its major moving averages also indicates that a sustained recovery would require substantial buying momentum.
For now, the recent rebound from $0.893 has not been sufficient to reverse the broader downtrend.
Although $XRP's price structure remains bearish, momentum indicators suggest that selling pressure may be becoming overstretched.
The daily Relative Strength Index stands near 27, placing the cryptocurrency in oversold territory. Meanwhile, $XRP's Moving Average Convergence Divergence indicator remains below zero.
The negative MACD reading suggests that bearish momentum continues to dominate despite the possibility of a short-term rebound.
$XRP's recent low at $0.893 represents an important downside reference as traders assess whether the cryptocurrency can stabilize.
With $XRP trading around $0.963, the market has recovered approximately 7% from Saturday's low.
However, the rebound has not yet established a clear bullish reversal. A successful defense of $0.893 could encourage further consolidation and potentially support a temporary recovery toward $1.
The psychological $1 level represents the first major resistance barrier. Reclaiming this threshold would be an important early step toward improving short-term market sentiment.
However, a sustained breakdown below $0.893 would weaken $XRP's technical outlook further. Such a move could expose the cryptocurrency to additional selling pressure, particularly if whale activity remains elevated and spot demand continues to deteriorate.
$XRP/USD Daily Chart
On the upside, a sustained move above $1 would suggest that short-term buying momentum is improving.
However, $XRP would still face resistance around $1.160, a horizontal level that could limit further gains. Beyond this barrier, the 50-day EMA near $1.217 represents another important technical obstacle.
The 100-day EMA at $1.261 and the horizontal resistance around $1.300 form a broader resistance zone.
A decisive breakout above these levels would provide stronger evidence that $XRP's bearish momentum is beginning to weaken.
Further resistance stands at the 200-day EMA near $1.325, followed by the higher horizontal barrier around $1.540.
AI disclosure: AI tools assisted with research and drafting of this piece. An Invezz editor reviewed the facts, sources and wording before publication. Any opinions or analysis are Invezz’s, not those of an automated system.

 invezz.com