XRP 6-Week Bearish Sentiment Revisits 2026 Extremes: Will Price Fall Further?
coinedition.com
23 m
$XRP slipped below $1 as selling pressure intensified across spot and derivatives markets, bringing the cryptocurrency back to levels last seen at its previous 2026 low. At the time of reporting, $XRP traded at $0.9871, down 4.09% over the past 24 hours.
Bitcoin lost 2.5% over the same period, while the broader crypto market fell about 2.3%. Per reports, persistent inflation and expectations of a Federal Reserve rate increase have put pressure on digital assets, although $XRP suffered steeper losses.
$XRP Bearish Sentiment Deepens as Short Exposure Rises
$XRP liquidations reached $13.95 million in 24 hours. Of that amount, $12.78 million came from long positions, accounting for 92% of the total. Open interest, however, rose 0.76% to $2.19 billion even as prices fell, suggesting that traders were adding short positions.
Know when your coins move
Alerts, real-time prices, and market news — all in one app
Point your phone camera to install
4.8 based on 40K reviews in the App Store and Google Play
Meanwhile, the funding rate fell into negative territory at -0.0067%, equivalent to -7.3% on an annualized basis. Selling pressure also extended across the futures market as taker selling exceeded buying by 10.6%, leaving the buy-to-sell ratio at 0.90.
The weakness extended to spot markets, where net outflows reached $50.87 million while trading volume declined 13.36%. Similarly, U.S. spot $XRP ETFs recorded $1.09 million in net redemptions on November 13.
Follow us onXfor real-time crypto updates.
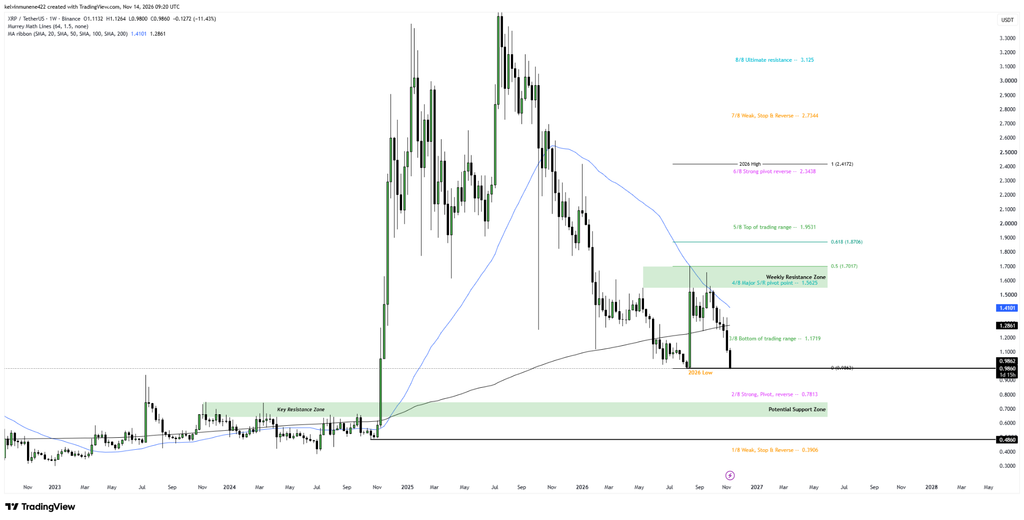
$XRP Risks 24%–35% Downside if Weekly Support at $0.9862 Fails
On the weekly chart, $XRP was down 11.43% at $0.9860. The token traded below both the 200-week and 50-week moving averages at $1.2861 and $1.4101. Notably, $XRP touched $0.9800 during the week, slipping beneath its previous 2026 low of $0.9862.
Source: TradingView
The weekly candle has yet to close, however, and a sustained break below that level could strengthen bearish sentiment. The next Murrey Math support level sits at $0.7813. Below it lies the $0.75–$0.64 region, which acted as resistance before the late-2024 breakout.
A decline into this area would represent losses of approximately 24%–35% from current levels. Further down, another historical support level sits at $0.4860.
What Could Invalidate $XRP’s Bearish Outlook?
In the near term, $XRP faces a long liquidation cluster at $0.9760, while short liquidations are concentrated around $1.006. A recovery would bring $1.1719 and the weekly moving averages back into focus. Beyond these levels, major weekly resistance extends from $1.50 to $1.69. A break above this region would expose the next resistance levels at $1.8706 and $1.9531.
Key $XRP Support and Resistance Levels
Price Level
Role
$1.8706–$1.9531
Higher resistance
$1.50–$1.69
Major weekly resistance
$1.1719
Intermediate resistance
$0.9862
Previous 2026 low
$0.7813
Murrey Math Support
$0.64–$0.75
Potential support zone
$0.4860
Historical support
Bullish Case
$XRP would first need to get back above $1.1719. That could bring the $1.50-$1.69 resistance area back into play.
Bearish Case
Below $0.9862 on a weekly closing basis, attention shifts to $0.7813 and then the $0.64–$0.75 range.
Neutral Case
Meanwhile, $XRP may spend more time trading near $1 if weekly support holds.
FAQs
1. Why Is the $XRP Price Falling?
Weak market conditions, spot outflows, and liquidations of long positions have weighed on the price.
2. Can $XRP Fall to $0.64?
Possibly, though sellers would need to push $XRP through other support levels first.
3. What Is $XRP’s Major Weekly Resistance?
On the weekly chart, resistance lies between $1.50 and $1.69.
4. What Could Strengthen $XRP’s Bearish Sentiment?
A weekly close below $0.9862 could reinforce the existing bearish sentiment.
Subscribe to our YouTube channel for the latest crypto news.
Related: Ethereum Foundation-Linked Wallet Sells 2,000 More ETH: Will Price Fall Further?

 coinedition.com