Falcon Finance price strength has not repaired the daily chart
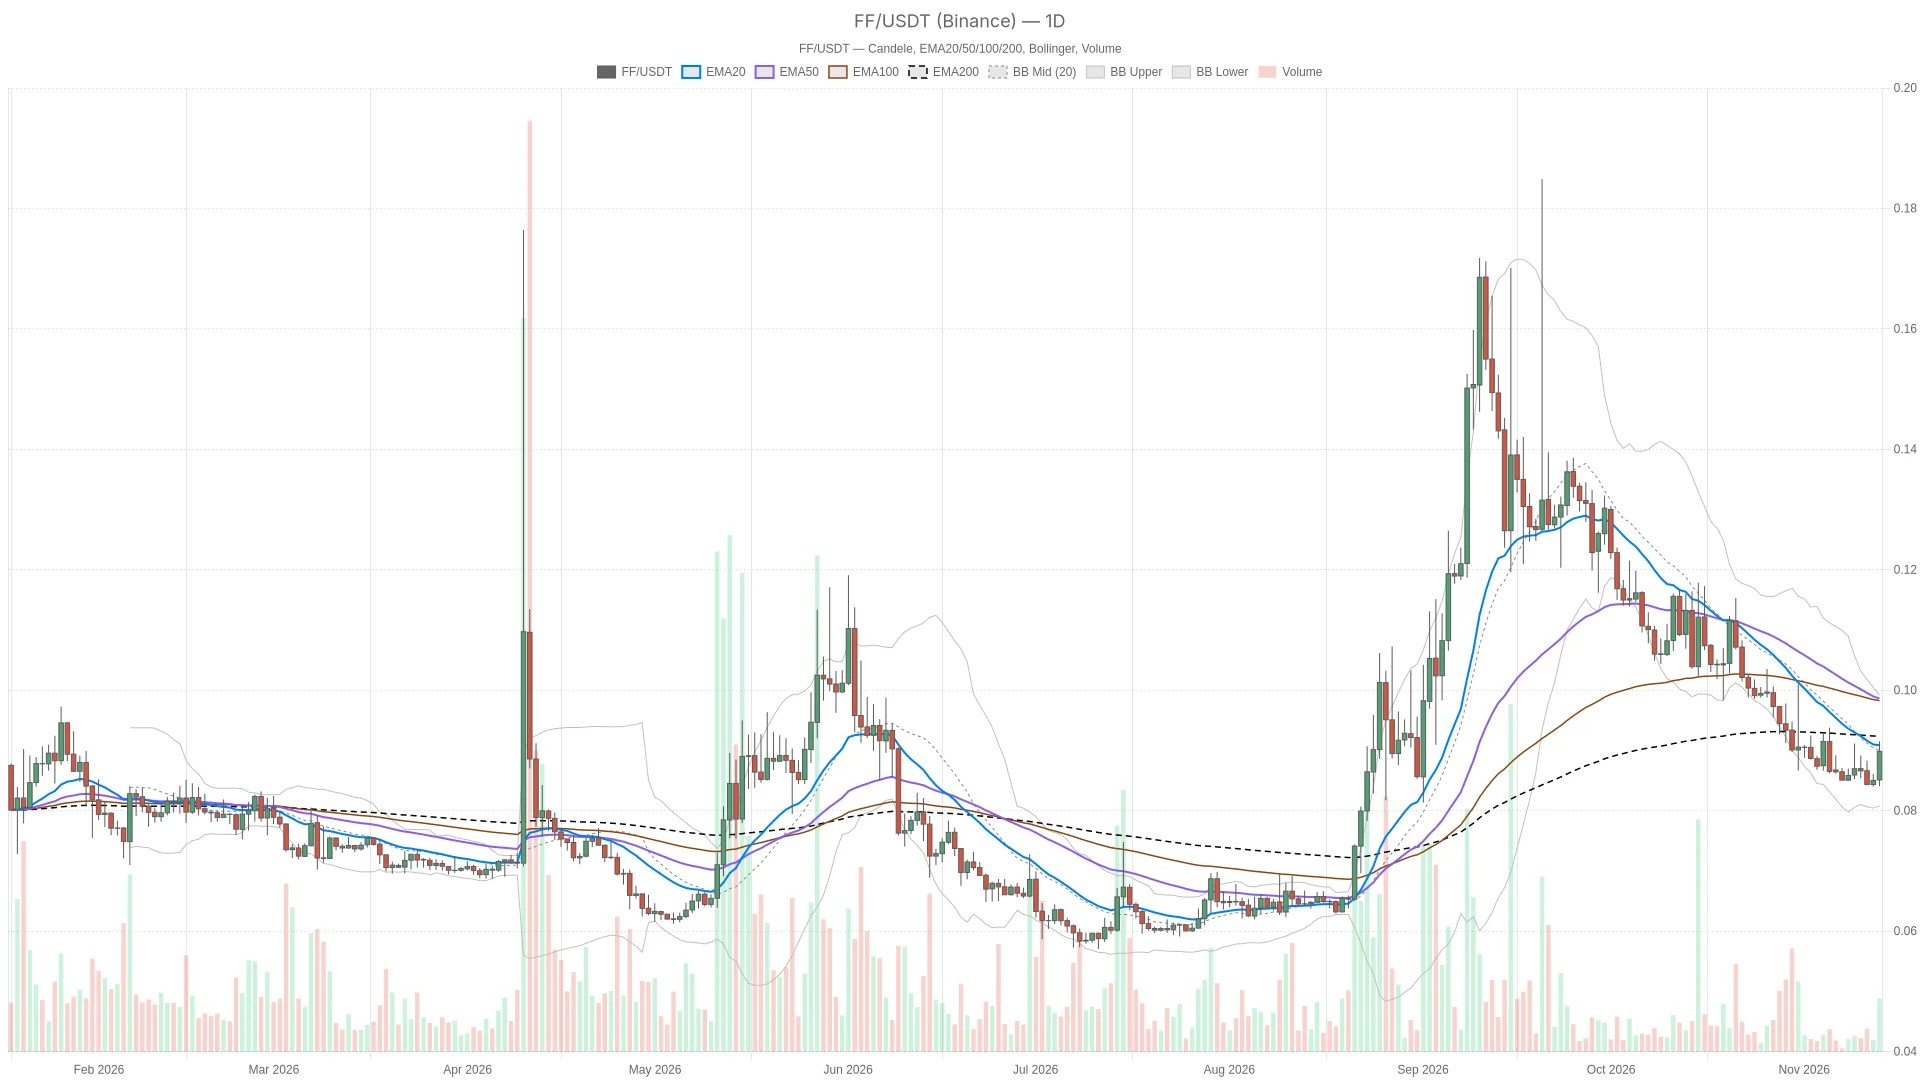
The daily chart has not confirmed the intraday recovery, as FF remains below all major daily moving averages. Binance candle data put FF below its daily 20-, 50- and 200-period EMAs. Those averages are not aligned, which argues against calling this a textbook bearish trend, but also leaves little basis for a bullish daily bias. Neutral is the main scenario until price can reclaim overhead structure.
Both the hourly and 15-minute charts tell a stronger story: price is above all three EMAs on each timeframe, with bullish alignment in both cases. That disagreement matters. Intraday trend-following conditions are constructive, while the broader move still looks like mean reversion toward daily resistance. The 15-minute chart helps judge execution conditions, not settle the daily direction.
Moving-average resistance limits the rebound’s room
Overhead moving averages cap the current rebound, with the daily EMA20 at $0.09100 as the nearest barrier. The daily EMA200 at $0.09240 and daily EMA50 at $0.09898 form successive overhead barriers beyond it. By contrast, the hourly EMA20 at $0.08835, hourly EMA50 at $0.08706 and hourly EMA200 at $0.08695 sit beneath price. The distinction is straightforward: short-term support is established, but recovery on the daily chart remains unfinished.
Daily Bollinger Bands place the midpoint at $0.09045, the upper band at $0.1005 and the lower band at $0.08044. Trading below the midpoint keeps the daily recovery tentative. Meanwhile, on the hourly chart, price is above the Bollinger midpoint at $0.08793 but below the upper band at $0.09185, consistent with a stronger local structure that still faces overhead limits.
The 15-minute Bollinger midpoint is $0.09014, above the live intraday price of $0.08990. That tempers the bullish EMA alignment: the execution chart is not showing unqualified strength. ATR measures $0.005289 daily, $0.001405 hourly and $0.0008256 on the 15-minute chart. Those ranges leave room for moves through nearby levels without necessarily changing the larger structure.
RSI favors the rebound, but hourly MACD loses force
Short-term momentum indicators support the rebound, yet the hourly MACD shows waning acceleration that questions sustainability. Daily RSI is 34.1, a weak reading but not oversold. Hourly RSI is rising at 62.5, while 15-minute RSI is also rising at 51.3. Momentum therefore favors the short-term rebound more than the daily trend; the execution timeframe has only a modest positive balance.
MACD adds an important qualification. The daily histogram is positive and widening even though the MACD line remains negative, supporting improving momentum rather than a completed trend reversal. The hourly histogram is positive but narrowing, so bullish momentum is losing force despite the stronger RSI. On the 15-minute chart, the histogram remains negative but is narrowing toward zero. These signals conflict: local downside momentum is easing, while the hourly advance is losing some acceleration.
Hourly resistance defines the bullish test; support defines failure
An hourly close above $0.09044 would confirm the bullish case, while a close below $0.08920 would signal failure. Bullish scenario: an hourly close above hourly R1 at $0.09044 would confirm a fresh break beyond the nearest overhead level. The daily Bollinger midpoint at $0.09045 sits immediately beyond it, making this a demanding test for FF. Clearance would bring the daily EMA20 into focus. An hourly close back below the hourly pivot at $0.08983 would invalidate this breakout scenario.
Bearish scenario: an hourly close below hourly S1 at $0.08920 would confirm a deeper failure of local support, exposing the hourly EMA20. An hourly close back above the hourly pivot would invalidate that breakdown. The last completed hourly candle already closed at $0.08982, marginally below the pivot, while the live price is above it; a pivot breakdown should therefore not be presented as a fresh, still-pending trigger.
Further below, daily R1 at $0.08609 is now support, followed by the daily pivot at $0.08504 and daily S1 at $0.08399. These are deeper reference points, not immediate bearish triggers. The likeliest false signal is a brief push through hourly R1 that fails beneath the daily resistance structure. ATR and the conflicting momentum readings make a wick through a level less persuasive than the specified closing confirmation.
Extreme Fear provides a defensive market backdrop
Broader market sentiment reads as Extreme Fear, reinforcing the cautious daily outlook without dictating FF’s own direction. Alternative.me’s Fear & Greed Index reads 20, classified as Extreme Fear. CoinGecko places total cryptocurrency market capitalization at $2.35 trillion and Bitcoin dominance at 58.95%. These readings provide a defensive sentiment backdrop, but do not establish the cause of FF’s move or override its own technical levels.
FAQ
Is FF’s main scenario bullish or neutral?
The daily scenario is neutral with a defensive tilt. Bullish hourly and 15-minute structures have not yet resolved the weakness beneath the daily moving averages.
Is FF oversold?
No. Daily RSI is weak at 34.1, but it is not below the oversold threshold. The stronger hourly reading does not, by itself, confirm a daily reversal.
Disclaimer: This article is for informational purposes only and does not constitute financial advice, an investment recommendation, or a solicitation to buy or sell any financial instrument or cryptocurrency. The analysis provided is not indicative of future results. Investing in crypto assets and financial markets carries a high risk of capital loss. Always do your own research (DYOR) and consult a qualified financial advisor before making any decision.
Article produced with the assistance of artificial intelligence and reviewed by the editorial team.

 en.cryptonomist.ch