The immediate contest is between oversold hourly conditions and deteriorating daily momentum. Short-term relief is possible, but it would not by itself repair the broader damage. Improving execution-timeframe momentum is not the same as recovering trend support.
Quantum price rebound signals conflict with the daily bias
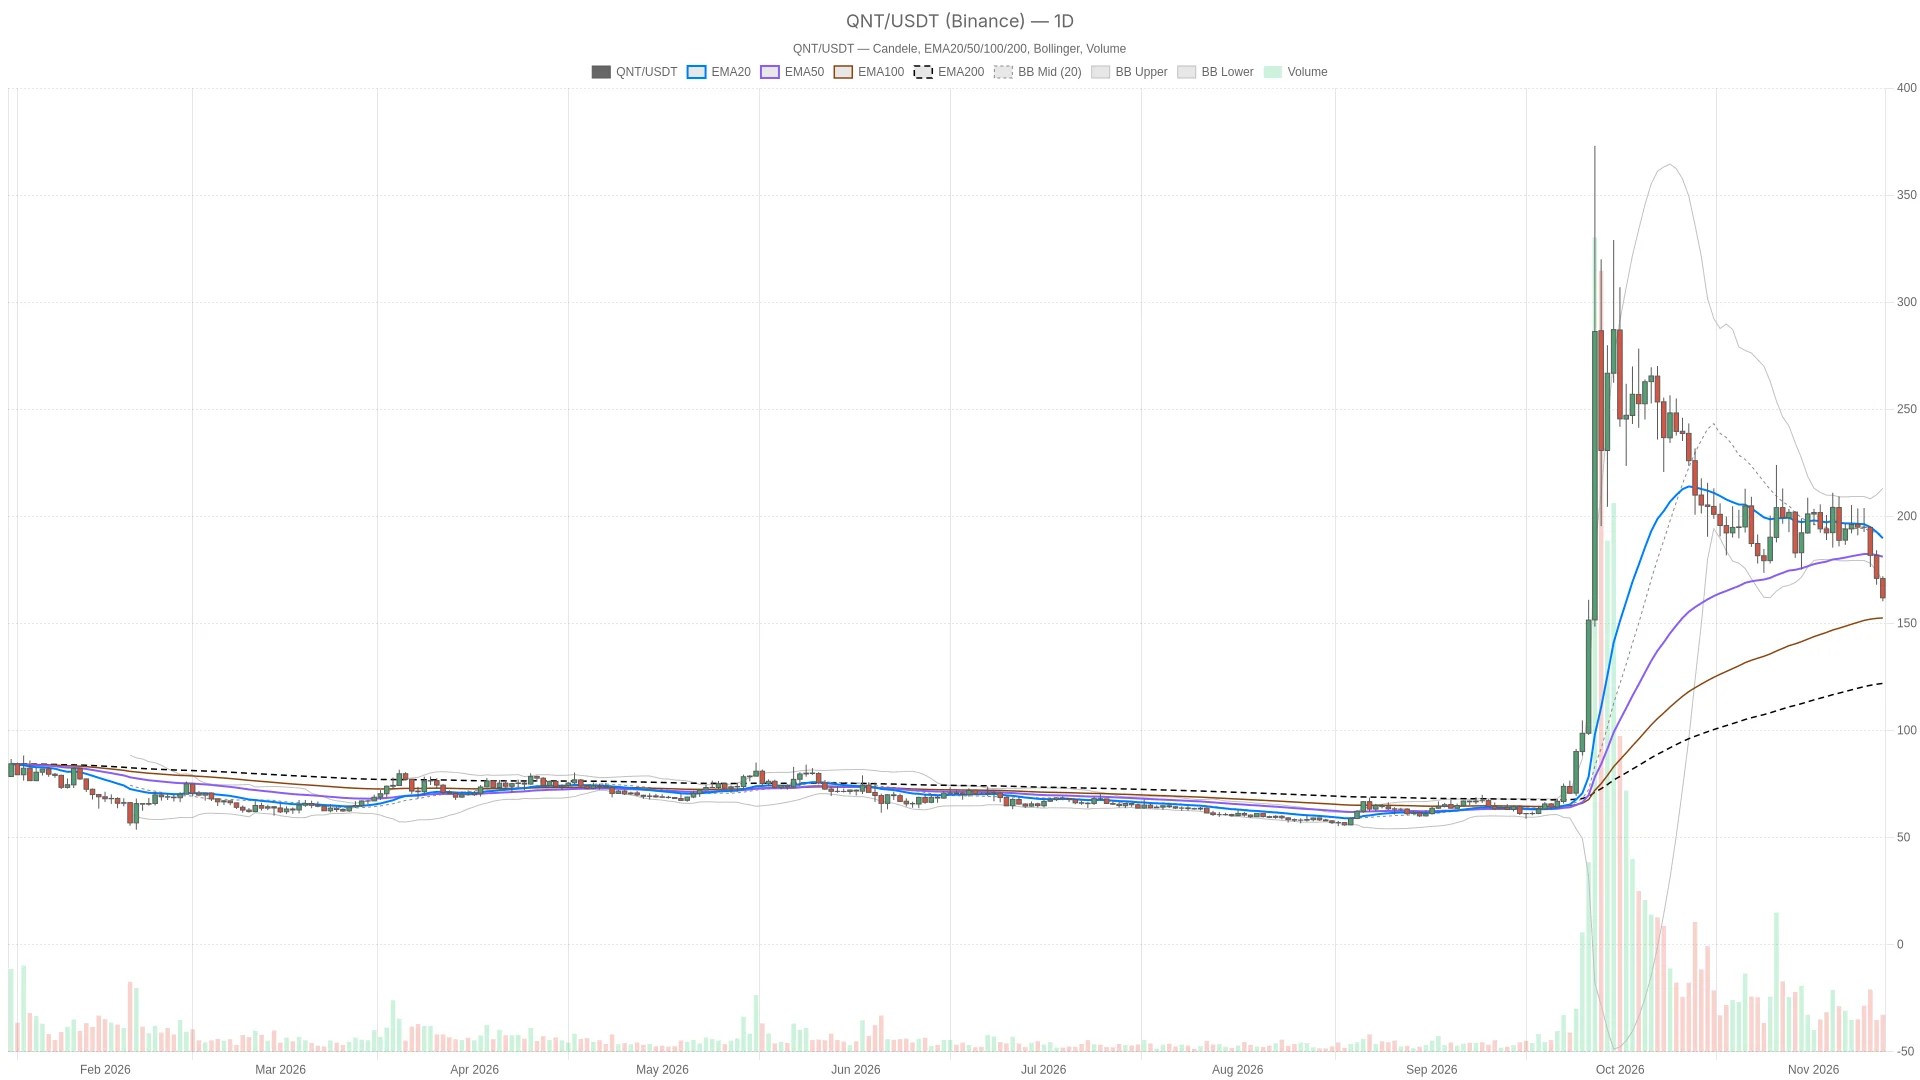
The daily averages retain a bullish ordering, yet price has fallen beneath the daily 20-period and 50-period EMAs. That leaves the longer-term structure intact on paper while its nearer-term price support has weakened. Binance’s last completed daily candle closed at $171.00; the live daily candle trades at $161.90 and is not a completed close.
Meanwhile, the hourly picture confirms the defensive bias rather than challenging it: price is below all three hourly EMAs, which are bearishly aligned. On the 15-minute chart, momentum is improving, but price also remains below all three EMAs in a bearish alignment. That disagreement makes the shortest timeframe useful for assessing a rebound’s execution, not declaring a daily reversal.
Broken daily support leaves a wide volatility envelope
Price sits well below its daily 20-period and 50-period EMAs, creating a wide gap that any recovery would need to close before the structure regains upside confirmation. The daily 20-period EMA stands at $192.65 and the daily 50-period EMA at $181.91, both above price. The daily 200-period EMA at $121.55 remains below it, preserving the long-term bullish ordering on paper.
On the hourly chart, the 20-period EMA at $166.35, 50-period EMA at $173.28 and 200-period EMA at $186.65 all sit overhead. Their bearish ordering reinforces the view that a rebound would initially be a move against the prevailing hourly trend.
Price is also below the daily lower Bollinger Band at $174.57, with the daily band midpoint at $192.32. That is a downside extension, not an automatic reversal signal. By contrast, price remains above the hourly lower Bollinger Band at $160.78 and below the hourly midpoint at $165.27: the immediate structure still offers room for movement in either direction without changing the daily assessment.
Consequently, daily ATR of $18.17 compared with hourly ATR of $2.72 and 15-minute ATR of $1.36 makes small intraday breaks less persuasive in isolation. A brief move through a nearby level could fit ordinary volatility rather than mark a durable change in direction.
Oversold hourly RSI meets a weakening daily MACD
RSI leaves room for relief, not confirmation
Daily RSI is falling at 39.5, consistent with weak directional conviction on the upside. Hourly RSI is oversold at 29.7, but its completed-reading trend is flat rather than improving. The 15-minute RSI is rising at 46.5, showing better short-term balance without yet establishing dominant upside momentum.
MACD separates a rebound attempt from a trend turn
The daily MACD histogram is negative and widening, reinforcing the deterioration in daily momentum. The hourly histogram is positive but narrowing, so its positive reading offers only limited counterweight to the bearish hourly structure. The 15-minute histogram has crossed above zero and is rising. Together, these readings support a relief-bounce possibility while leaving the daily weakness unresolved.
Hourly $162.94 resistance separates recovery from another failed bounce
The nearest support is the hourly pivot at $161.73, while the nearest resistance is hourly R1 at $162.94. Beyond that resistance, daily S1 at $164.65 is also overhead resistance despite its support-style label. The daily pivot at $174.40 marks a more distant recovery hurdle, not an immediate upside trigger.
Bullish scenario: an hourly close above hourly R1 at $162.94 would confirm a local recovery attempt, opening a test of daily S1 at $164.65. An hourly close back below the hourly pivot at $161.73 would invalidate that setup. The likeliest false signal is a brief push above hourly R1 that cannot hold on a completed candle, especially while the broader hourly trend remains bearish.
Bearish scenario: an hourly close below the hourly pivot at $161.73 would confirm renewed downside pressure, exposing the hourly lower Bollinger Band at $160.78 and then hourly S1 at $160.70. An hourly close above hourly R1 at $162.94 would invalidate this immediate breakdown scenario. Its main trap is a short-lived break below the pivot followed by recovery, given the oversold hourly RSI.
Beyond these immediate levels, the supplied daily references place the next support below current price at the daily 200-period EMA at $121.55. That is a structural reference, not an automatic destination if nearby hourly support fails; the gap between those references adds uncertainty rather than precision.
Fear and a contracting market cap frame a defensive backdrop
On the sentiment side, Alternative.me’s Fear & Greed Index reads 28, classified as Fear. CoinGecko puts total crypto market capitalization at $2.42 trillion, down 5.66% over 24 hours, with Bitcoin dominance at 59.60%. This is a defensive backdrop for $QNT’s recovery attempt, although those aggregate figures do not establish what caused $QNT’s move.
FAQ
Is the main $QNT scenario bullish or bearish?
The daily assessment is neutral with a bearish tactical bias. Long-term EMA support survives, but shorter-term structure and daily momentum do not yet confirm a reversal.
Does an oversold reading establish a bottom?
No. In this setup, hourly RSI supports the possibility of relief, while the bearish hourly EMA alignment leaves that rebound vulnerable to failure.
Disclaimer: This article is for informational purposes only and does not constitute financial advice, an investment recommendation, or a solicitation to buy or sell any financial instrument or cryptocurrency. The analysis provided is not indicative of future results. Investing in crypto assets and financial markets carries a high risk of capital loss. Always do your own research (DYOR) and consult a qualified financial advisor before making any decision.
Read also: Can Ethereum’s oversold bounce clear the $2,039 hourly hurdle?
Article produced with the assistance of artificial intelligence and reviewed by the editorial team.

 en.cryptonomist.ch