Is SHIB History About to Repeat? Analyst Eyes 67% Rally Toward $0.00000725
coinedition.com
12 November 2026 13:54, UTC
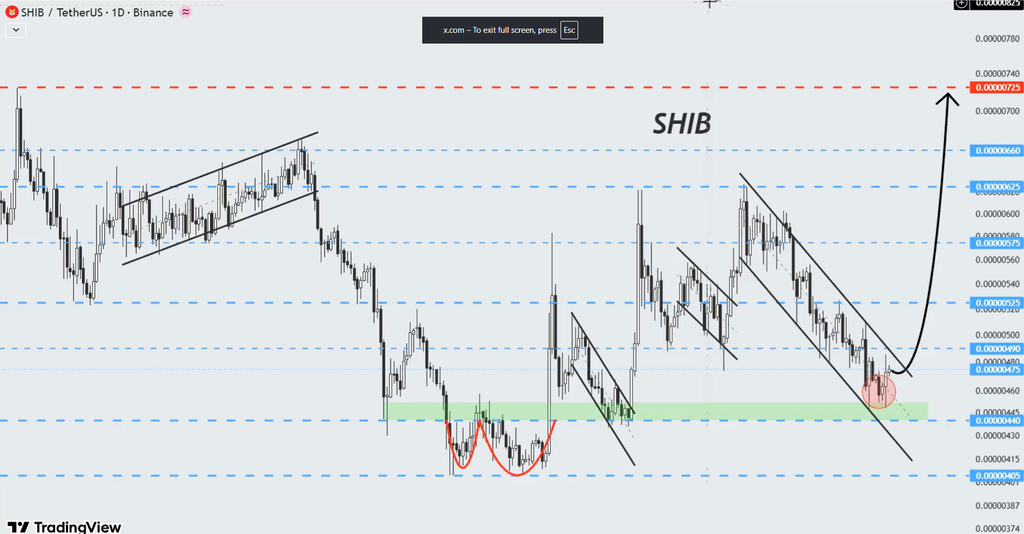
Shiba Inu is back near a level watched by analyst Lana Valentis, whose chart outlines a possible move to $0.00000725. That would put $SHIB about 67% above its November 12 price. For now, however, the breakout shown on her chart has not happened.
Indicator
Reading
Reference Price
$0.00000434
24-Hour Change
−2%
Market Structure
Descending channel
Upside Target
$0.00000725
Potential Upside
67%
Shiba Inu Price Analysis Weighs 2021 History Against 67% Target
Valentis drew a comparison with the token’s early trading days. After launching in August 2020, Shiba Inu spent roughly eight months with little activity, according to CoinMarketCap. It then rose about 17 million percent over approximately 15 months.
Know when your coins move
Alerts, real-time prices, and market news — all in one app
Point your phone camera to install
4.8 based on 40K reviews in the App Store and Google Play
The comparison is part of Valentis’s forecast, not a repeat of those conditions. Meanwhile, her daily chart shows $SHIB trading within a descending channel, with prices forming successive lower highs and lower lows.
The latest decline has brought the token closer to a highlighted green demand zone, where buyers could attempt to regain control. Although Valentis’s chart outlines a potential move above the channel from this zone, the price analysis has yet to show a confirmed breakout through descending resistance.
$SHIB Price Analysis Tracks Resistance Before Any Breakout
By November 12, $SHIB was changing hands near $0.00000434, down about 2% in 24 hours, CoinMarketCap figures showed. Technical readings placed immediate support at $0.00000430, just below that price. Similarly, the price analysis marks $0.00000445 as resistance.
That leaves Shiba Inu trading within a narrow band just above the support level, but still below the first resistance level needed to strengthen the initial bullish case. A sustained move through resistance, accompanied by stronger volume, would lend weight to Valentis’s recovery scenario.
Until then, the chart continues to show lower highs and lower lows within the descending channel. The downside levels are also defined. If $SHIB loses the $0.00000430 support, the next areas identified in the technical readings are $0.00000418 and $0.00000404.
Follow us onXfor real-time crypto updates.
Shiba Inu Price Analysis Maps Four Upside Targets
Meanwhile, Valentis’s forecast sets out four successive targets, starting at $0.00000490, should a bullish breakout occur. The next levels are $0.00000525 and $0.00000625, followed by the highest target at $0.00000725.
Source: X
Measured against the November 12 price of $0.00000434, the final target represents approximately 67% upside. Reaching it would require a break above descending resistance and further gains through the levels mapped on the chart.
Other market readings have not yet confirmed that shift. CoinMarketCap reported Shiba Inu trading below its seven-day, 30-day, and 200-day moving averages, while trading volume had fallen 12.71%.
Key $SHIB Price Levels
Price Level
Technical Significance
$0.00000725
Final bullish target
$0.00000625
Third upside target
$0.00000525
Second upside target
$0.00000490
Initial upside target
$0.00000445
Immediate resistance
$0.00000430
Immediate support
$0.00000418
Secondary support
$0.00000404
Lower support
Bullish Case
A sustained breakout above $0.00000445 with stronger volume would support recovery toward $0.00000490 and subsequent targets.
Bearish Case
Yet, failure to hold $0.00000430 support would expose $0.00000418 and $0.00000404, extending the existing downward structure.
$SHIB Price Analysis FAQs
1. Can $SHIB Reach $0.00000725?
Valentis identifies it as a potential target, but the breakout remains unconfirmed.
2. What Is $SHIB’s Immediate Resistance?
Shiba Inu’s immediate resistance stands near $0.00000445.
3. Where Is $SHIB’s Nearest Support?
The meme coin’s immediate support sits around $0.00000430.
4. Is Shiba Inu Showing Bullish Momentum?
Not yet. The $SHIB price remains below three moving averages, while volume has fallen 12.71%.
Subscribe to our YouTube channel for the latest crypto news.
Related: Memecoin Price Analysis: DOGE, $SHIB Face Breakdown Risk as PEPE Gains Momentum

 coinedition.com