Bitcoin and Ethereum have been trading sideways for the past few months. Now, different technical patterns suggest they are bound for a bearish impulse before resuming their respective uptrends.
Bitcoin Holds Above Key Support Level
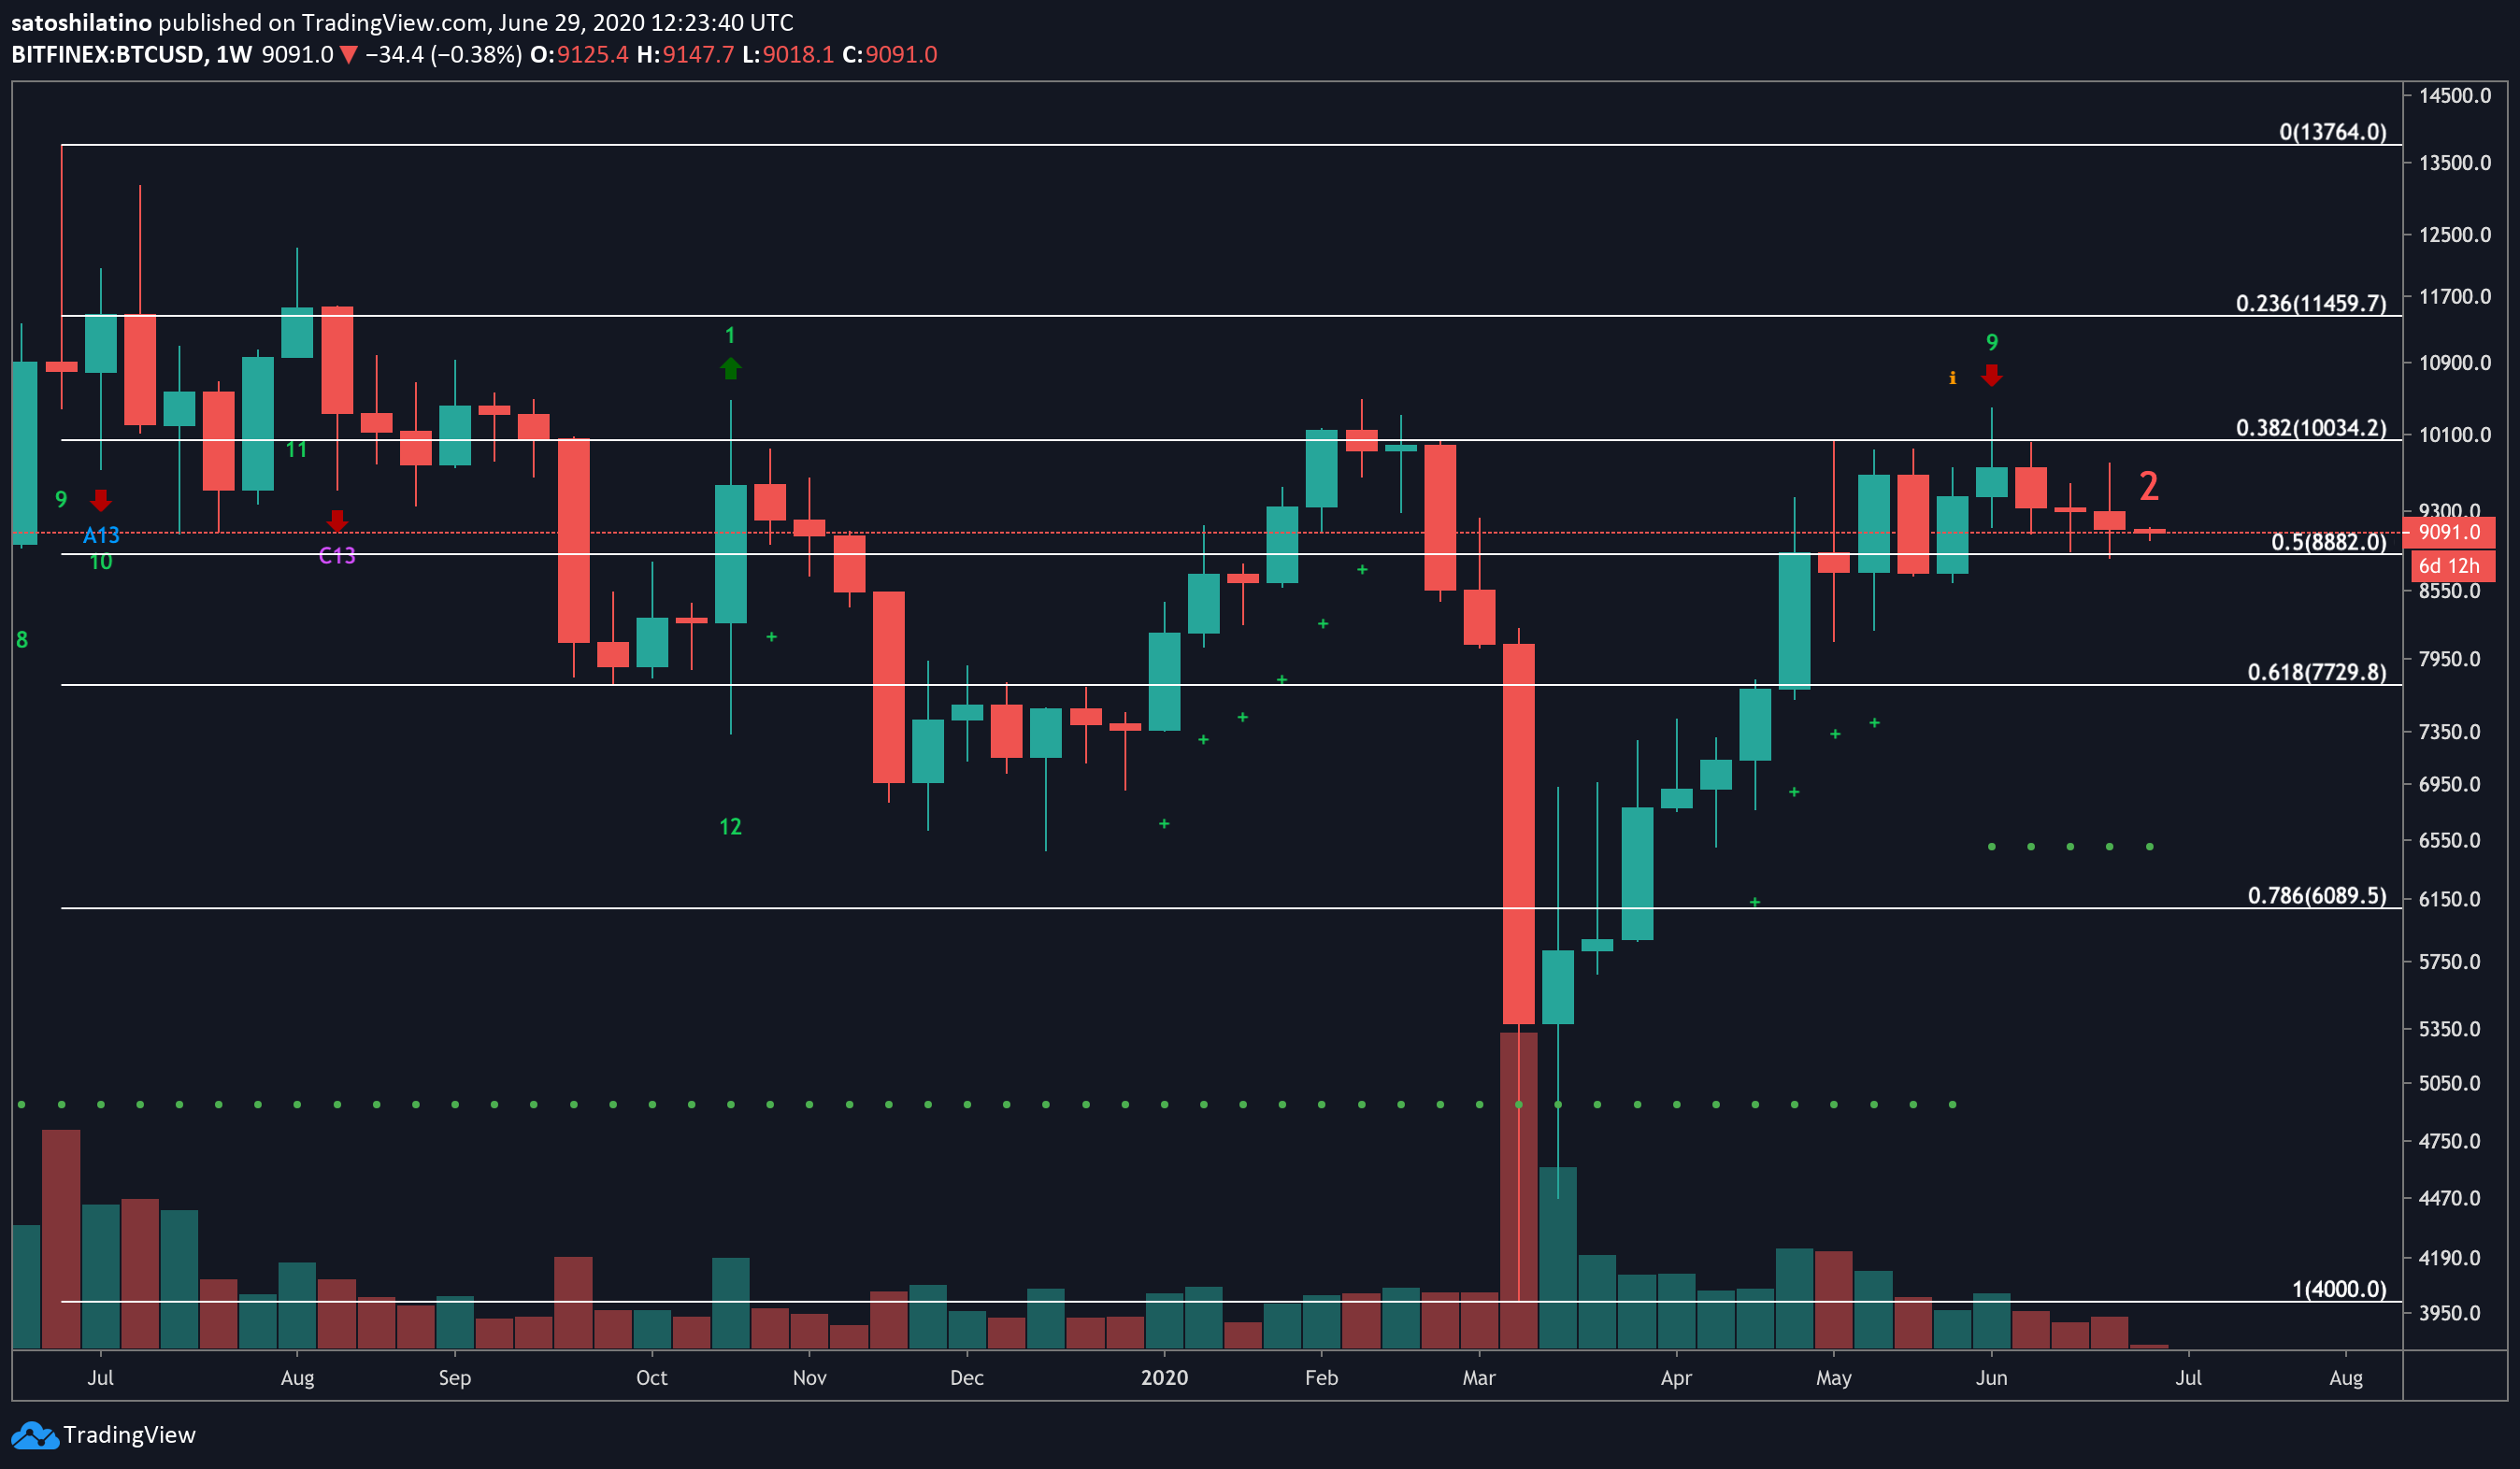
Bitcoin has been consolidating within a narrow range for the past two months without providing any clear signs of where it is headed.
Since early May, its price has mostly traded between the 50% and 38.2% Fibonacci retracement levels that sit at $8,900 and $10,000, respectively.
Due to the significance of these support and resistance levels, breaking out of this zone will be the catalyst that determines the direction of BTC’s trend. Until that happens, investors must wait to avoid getting caught on the wrong side of the breakout.

Despite the uncertainty around the flagship cryptocurrency, the TD sequential indicator estimates that momentum for a bearish impulse is building up slowly. This technical index presented a sell signal in the form of a green nine candlestick at the beginning of the month.
The bearish formation forecasts a one to four candlestick correction before Bitcoin resumes its historic uptrend.
Such a pessimistic scenario aligns with Willy Woo’s outlook.
The on-chain analyst believes that Bitcoin was preparing to enter a new bullish cycle at the beginning of the year. However, the market crash of mid-March and fears over the ongoing global pandemic appear to have “killed the party.”
Woo maintains that Bitcoin is now be bound for another bearish month before it finally enters a new bull market based on a proprietary technical model.
“The longer this bull market takes to wind up, the higher the peak price. A long sideways accumulation band is ultimately a good thing,” said Woo.
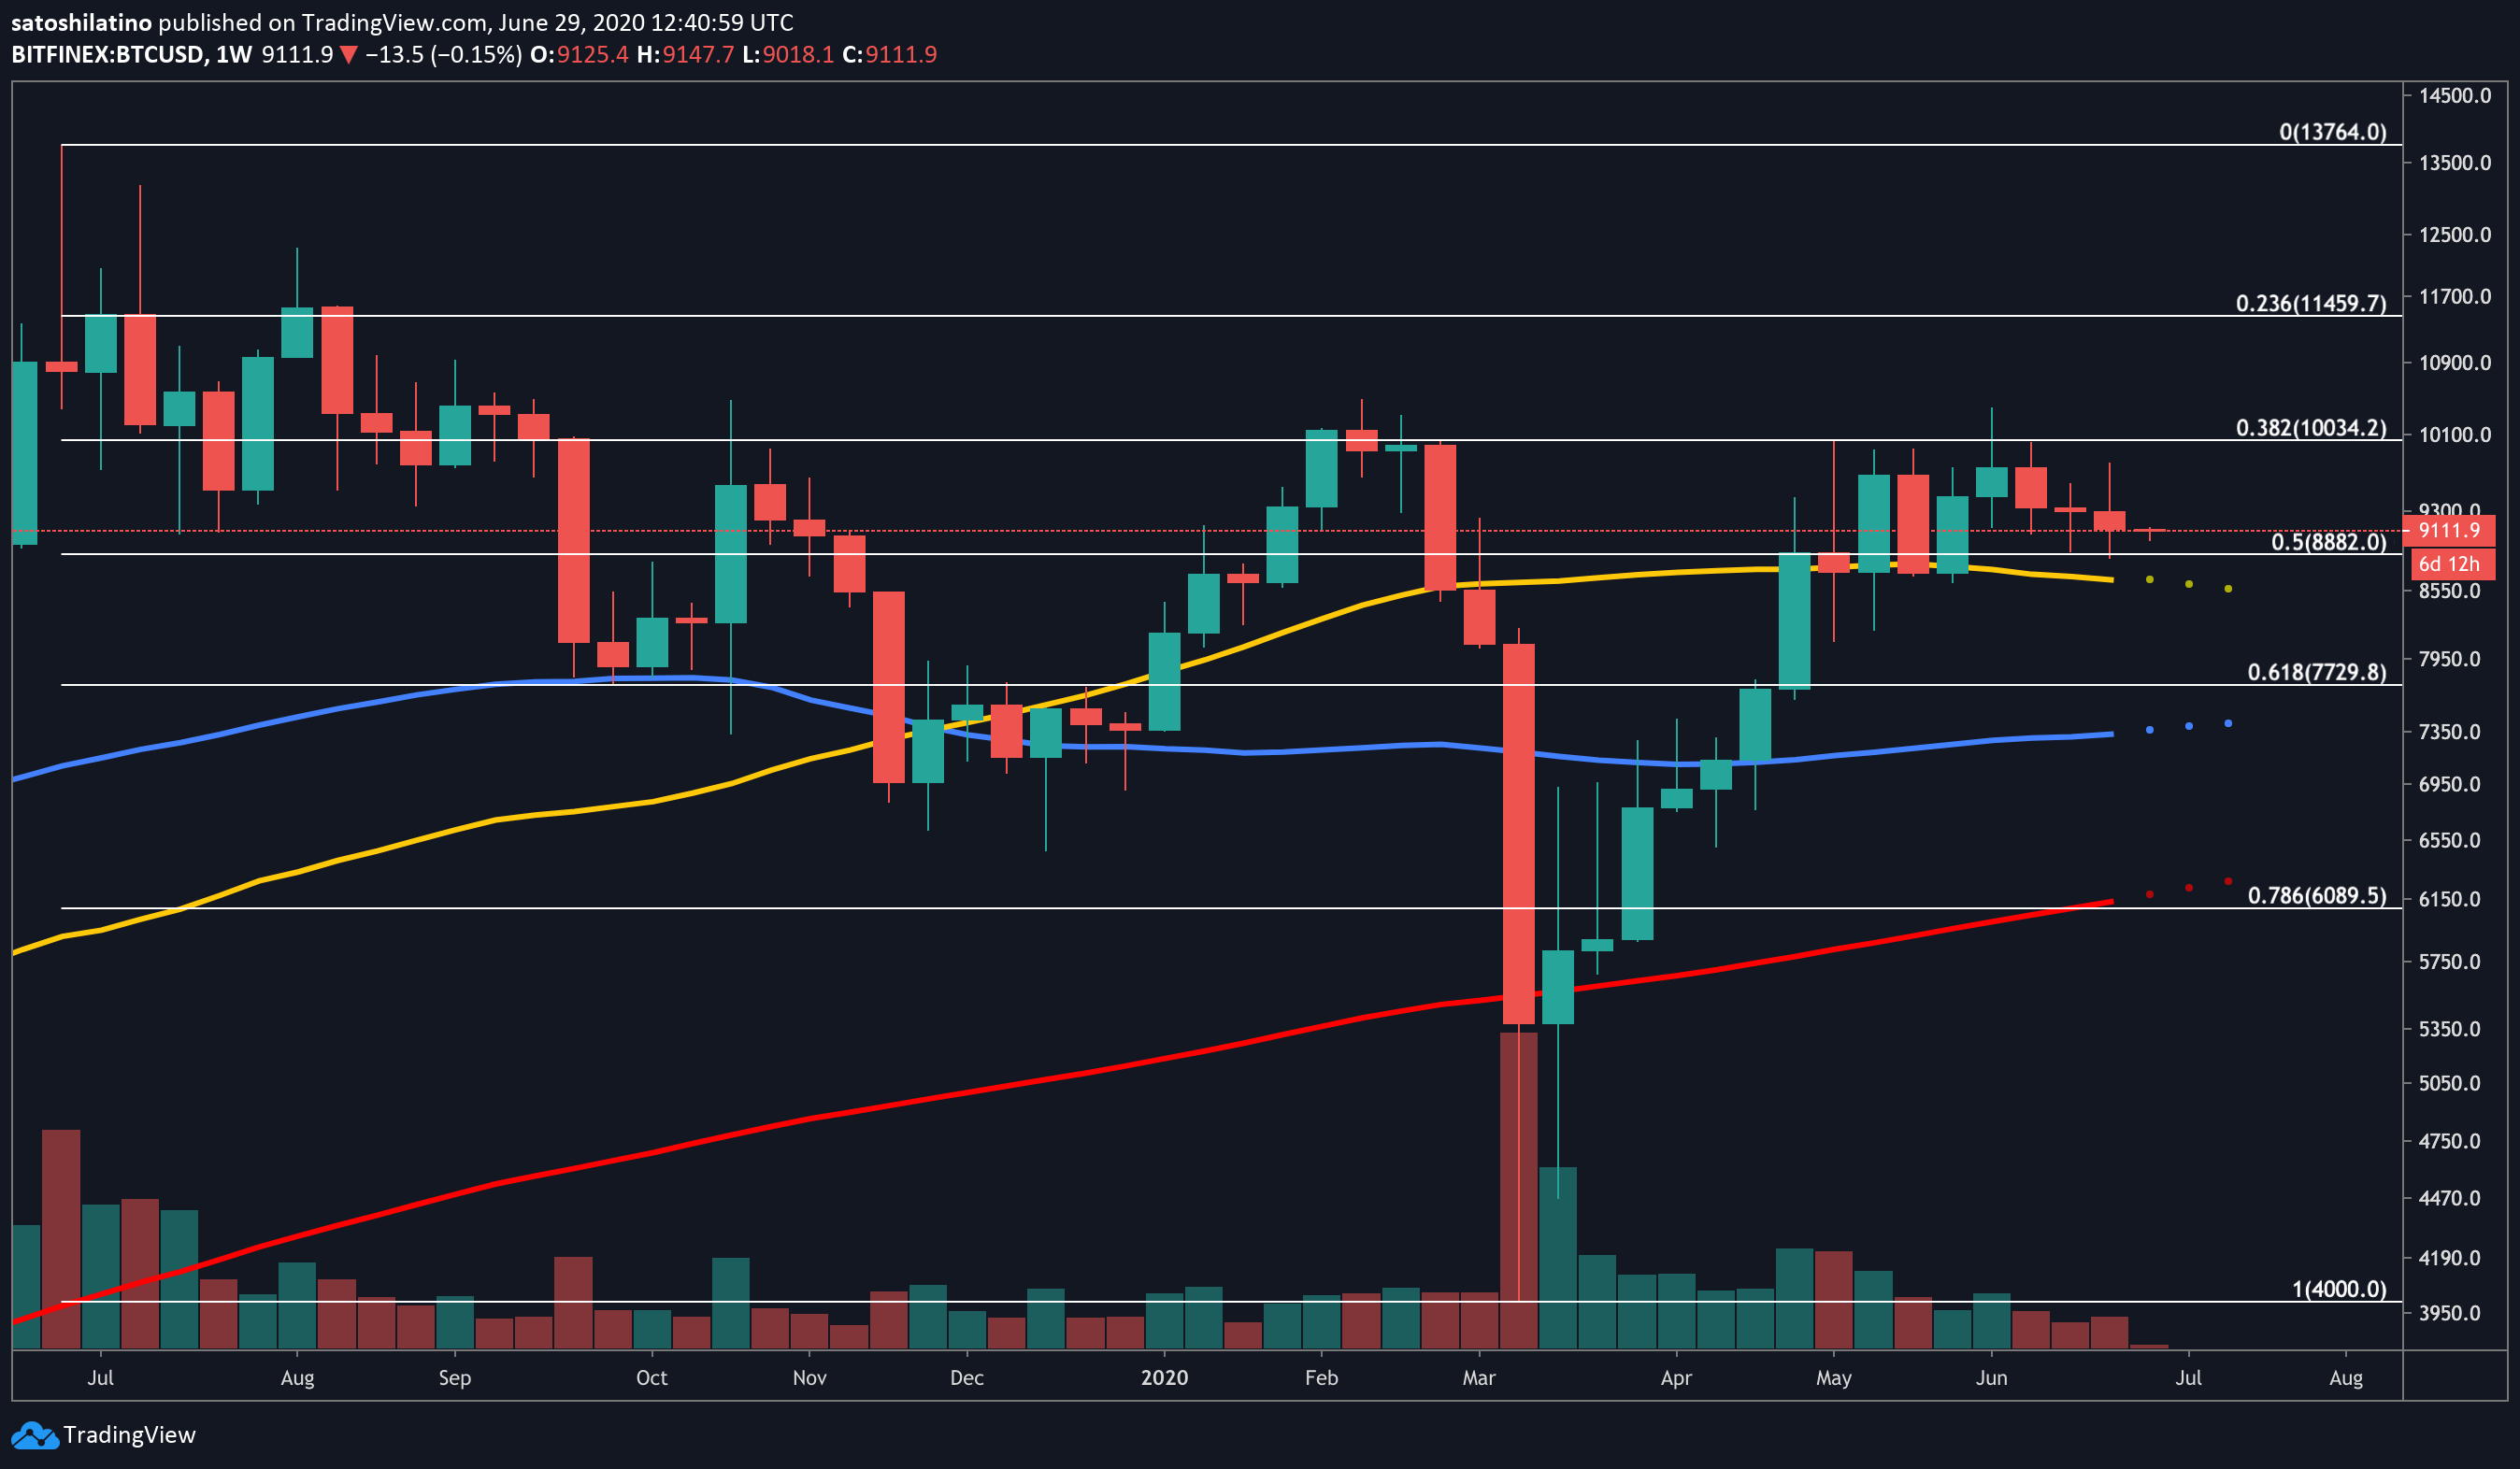
If this is the case, Bitcoin must first break below the $8,900 support barrier before the bearish outlook can be confirmed. This price level represents a substantial hurdle as both the 50% Fibonacci retracement level and the 50-week moving average are adding an extra layer of strength to it.
An increase would likely follow a weekly candlestick close below this support area in the selling pressure behind BTC. On its way down, the pioneer cryptocurrency may find support around the 100-week or 200-week moving averages, which is also where the 61.8% and 78.6% Fibonacci retracement levels sit.
These supply walls are currently hovering around $7,700 and $6,100, respectively.
It is worth noting a significant spike in demand could jeopardize the bearish outlook.
If this were to happen, Bitcoin may rise to close above $10,000. Moving past this price hurdle increases the odds for a further advance towards $11,500 or $13,800.
Ethereum Looks Weak at Current Price Levels
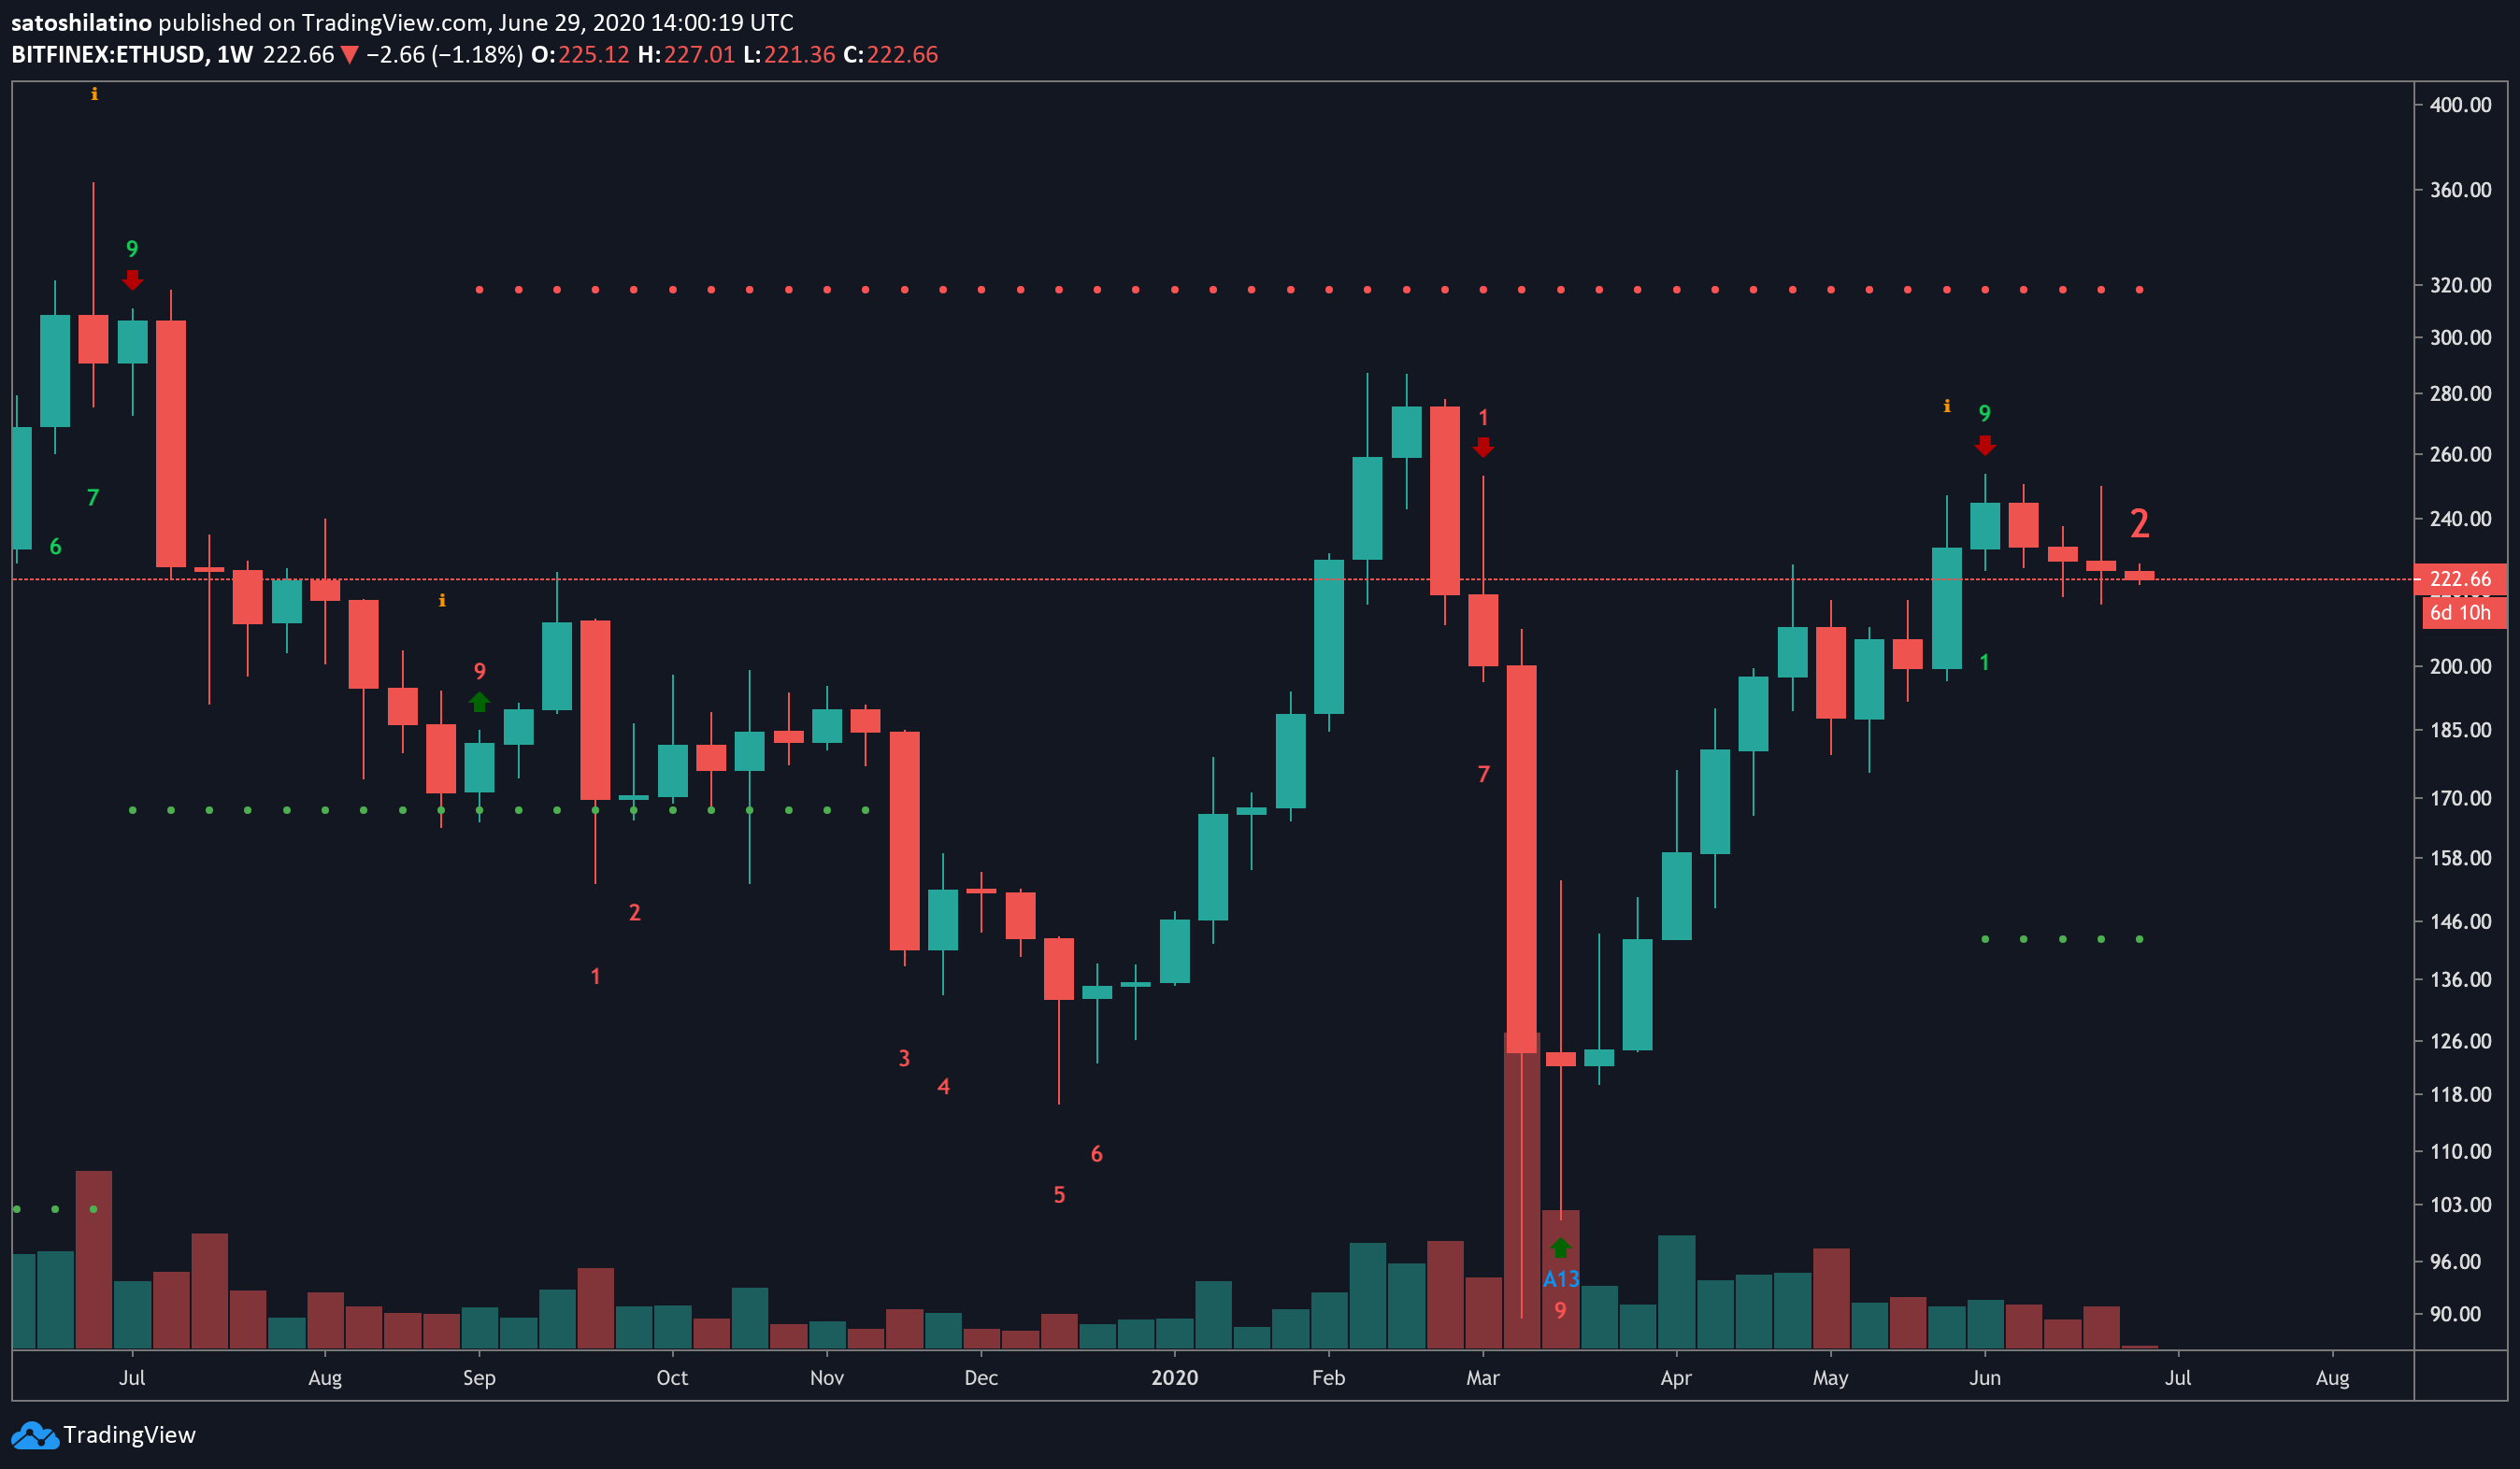
Ethereum has also endured a stagnation phase since the beginning of June.
Since then, the smart contracts giant has mostly traded between the $217 support and the $250 resistance level. The lackluster price action has made it nearly impossible to determine what the future holds for Ether.
However, the TD sequential index presented a sell signal in the form of a green nine candlestick on ETH’s 1-week chart. A further increase in sell orders behind this cryptocurrency will validate the bearish formation.
Under such circumstances, the TD setup forecasts a one to four weekly candlesticks correction.
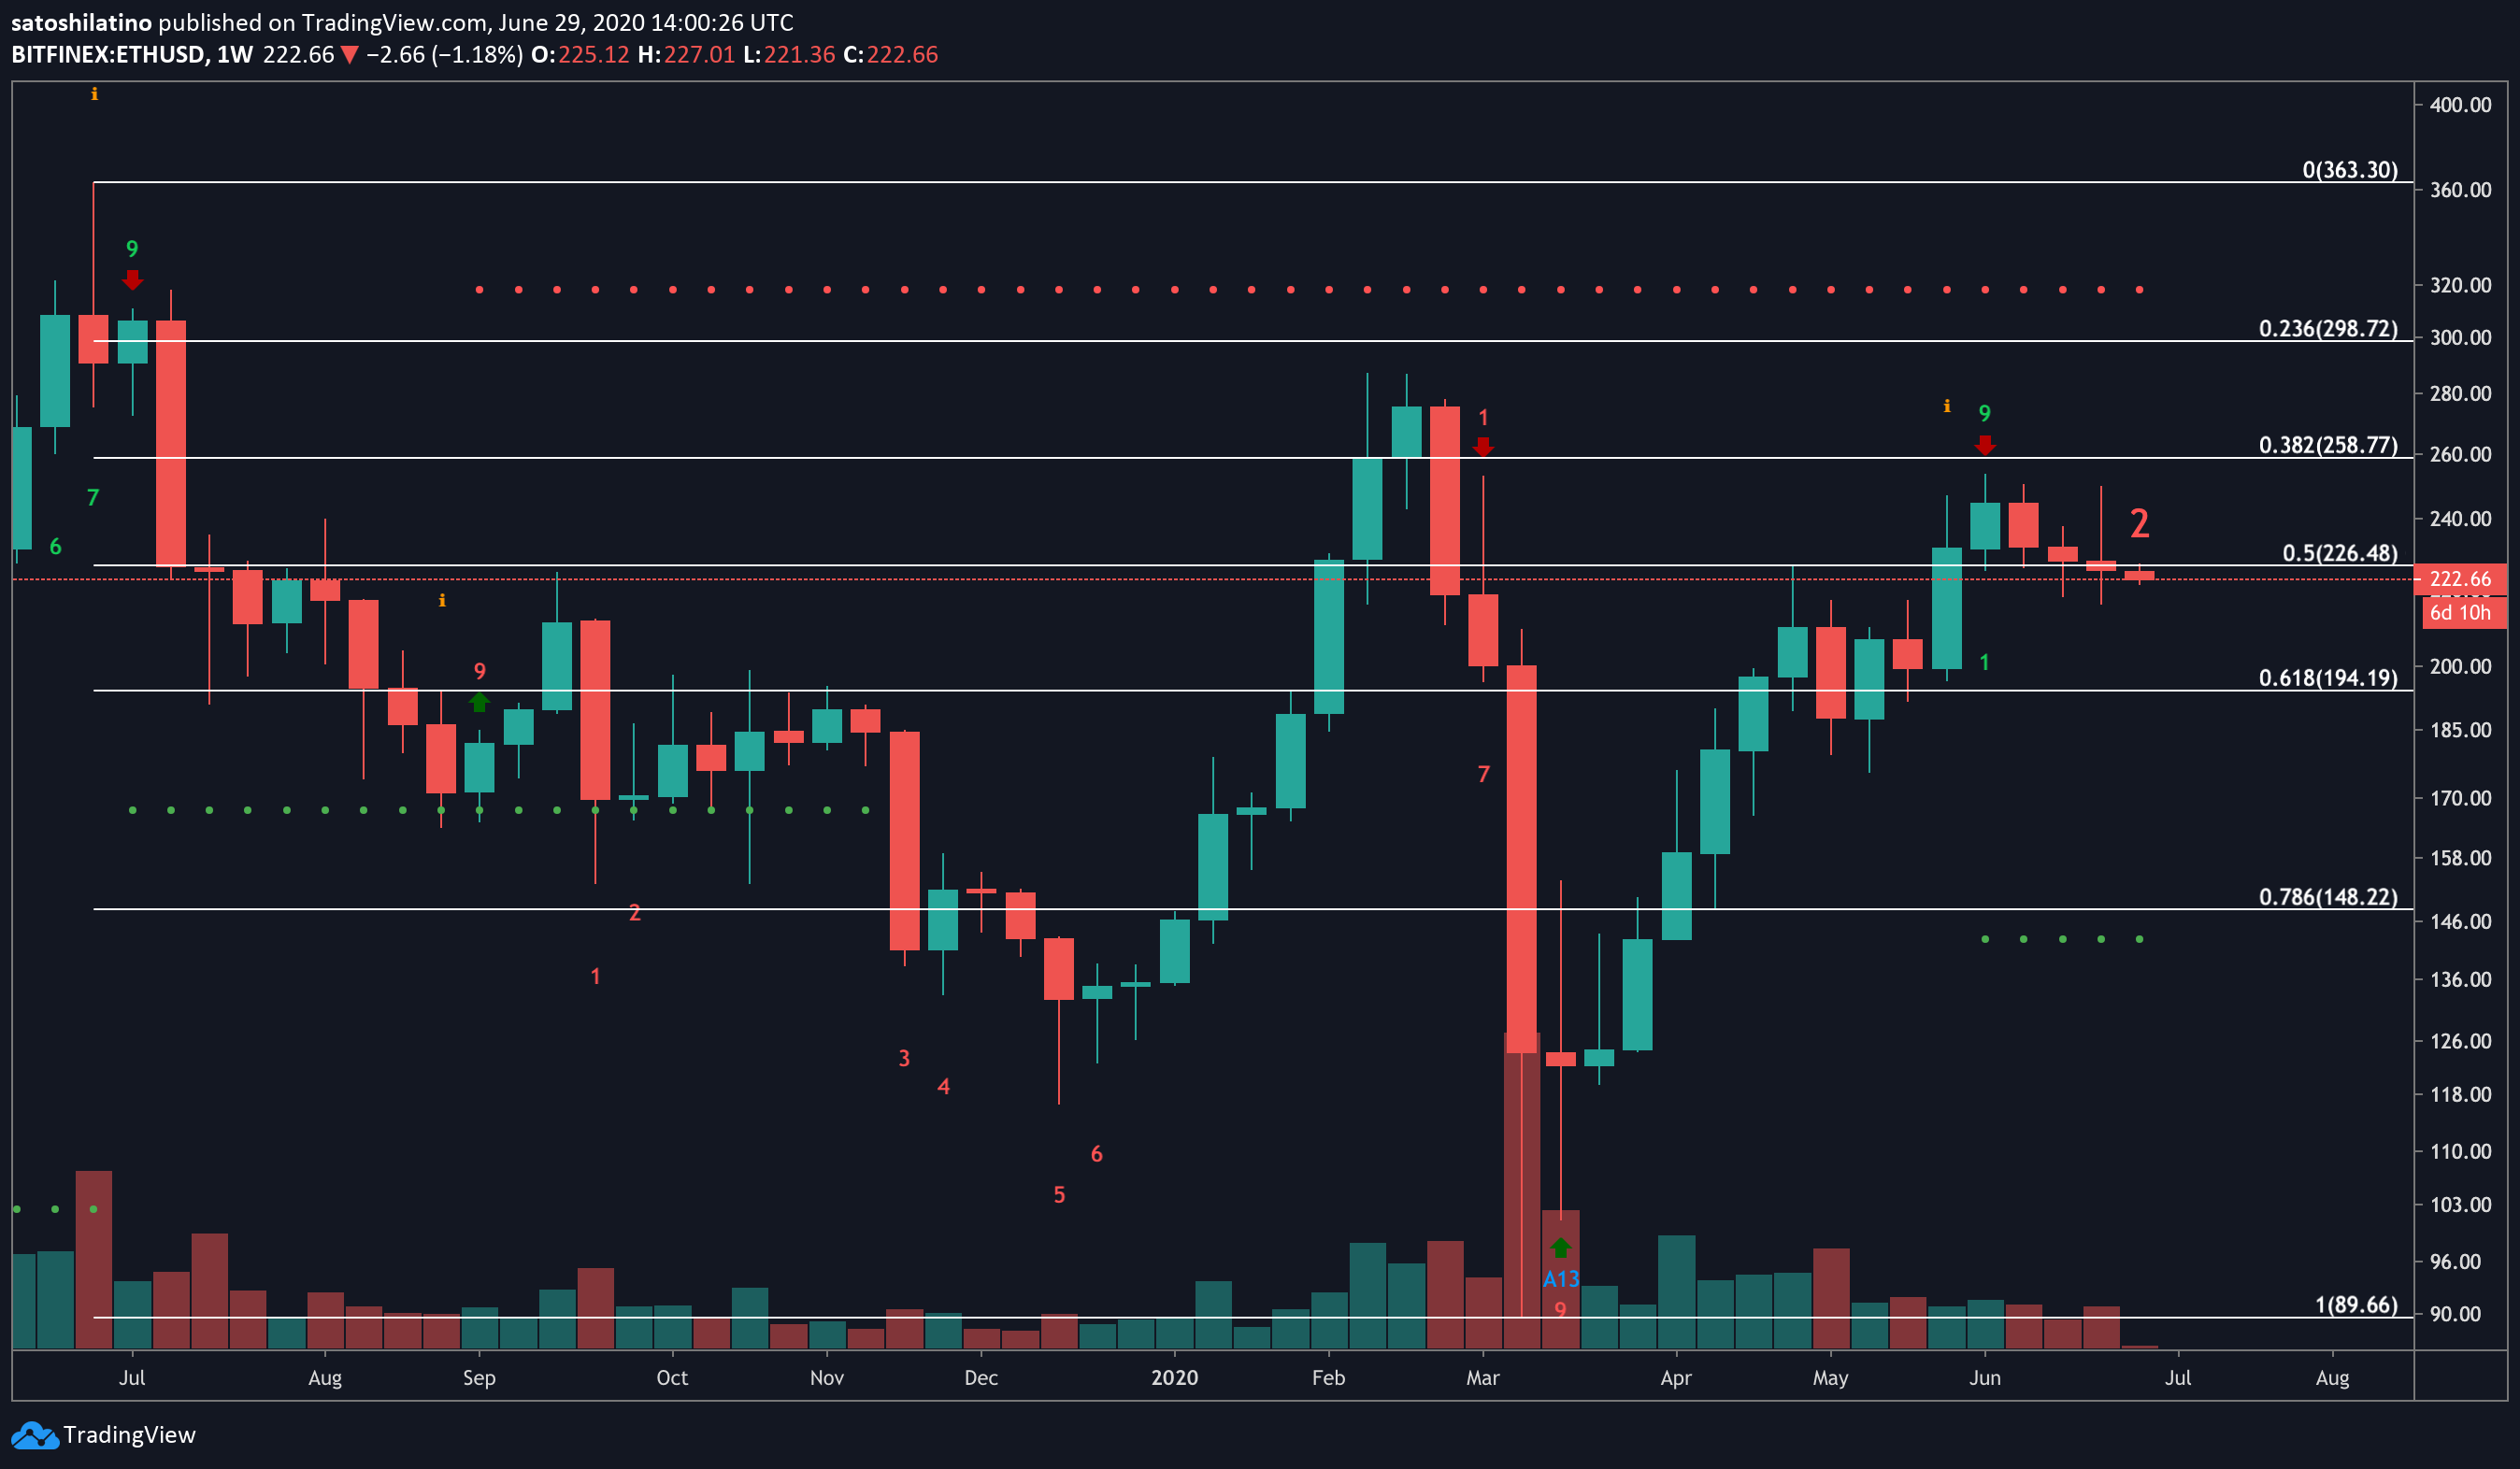
Even though the support provided by the 50% Fibonacci retracement level seems to have been violated, this area continues to be of high interest for bears.
A decisive move below this zone, especially below the recent swing low of $216, would likely send Ether towards the next support barrier at $200.
IntoTheBlock’s “In/Out of the Money Around Price” (IOMAP) model reveals that 1.24 million addresses had previously purchased 9.6 million ETH.
This significant supply barrier could prevent Ether from a steeper decline because holders within it would likely try to remain profitable in their long positions. They may even buy more ETH to avoid potential losses.

Due to the volatility of the cryptocurrency market, the bullish outlook cannot be taken out of the question. But there is a massive supply barrier ahead of Ethereum that may absorb any upside pressure.
The IOMAP cohorts show that for Ether to reach its upside potential, it must first break above the $230 to $243 resistance wall.
Around these price levels, roughly 2.7 million addresses had previously bought over 15 million ETH.
The Crypto Market Moves Forward
The uncertainty in the cryptocurrency market has sparked fear among investors, according to the Crypto Fear and Greed Index. Regardless, market participants continue adding Bitcoin and Ethereum to their portfolios.
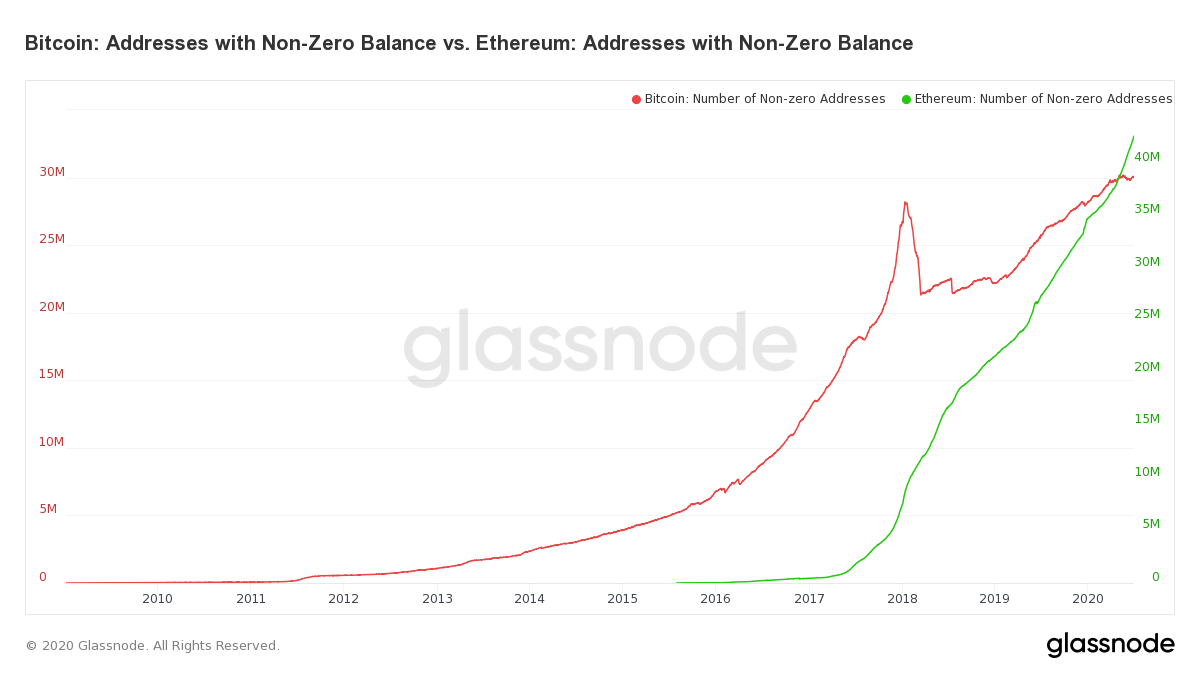
Data from Glassnode reveals that the number of addresses with a balance in BTC recently moved past the 30 million mark. Meanwhile, the number of ETH addresses with non-zero balances reached an all-time high of nearly 42.4 million addresses.
The high levels of interest in the cryptocurrency market suggest that, in the event of a correction, sidelined investors would likely reenter the market.
A new influx of capital will eventually help propel Bitcoin and Ethereum into higher highs.