Pepe Price Prediction: PEPE Bulls Face Resistance as Weakening Futures Flows Raise Correction Risks
coinedition.com
19 m
Pepe ($PEPE) continues to maintain a bullish daily structure, although weakening derivatives activity and persistent capital outflows threaten its recovery momentum. The memecoin trades around $0.000005297 after declining 1.51% over the past 24 hours. Besides, buyers continue defending the psychological $0.0000050 level despite repeated rejection near $0.00000552.
$PEPE Bulls Defend Key Support as Resistance Approaches
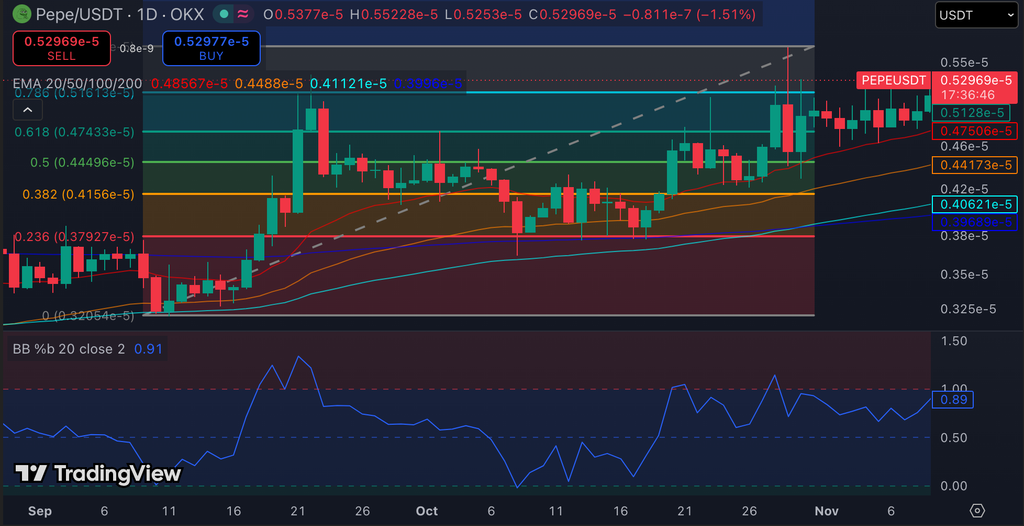
$PEPE maintains a constructive technical outlook despite its latest pullback. The token trades above its 20-day, 50-day, 100-day, and 200-day exponential moving averages (EMAs). This alignment suggests that buyers retain control of the broader market direction.
Significantly, the 20-day EMA at $0.0000048567 provides immediate dynamic support. The 50-day EMA at $0.0000044888 offers another important defensive level. Hence, maintaining these averages could help $PEPE preserve its bullish structure.
Know when your coins move
Alerts, real-time prices, and market news — all in one app
Point your phone camera to install
4.8 based on 40K reviews in the App Store and Google Play
$PEPE Price Dynamics (Source: TradingView)
However, the $0.00000552 resistance remains the immediate obstacle. A daily close above this level could encourage additional buying. Consequently, $PEPE could advance toward $0.00000580, its next major upside target.
On the downside, $0.00000513 represents immediate support. A breakdown could expose the $0.00000474 Fibonacci level. Further weakness could push prices toward $0.00000445 and $0.00000415.
Related: Pi Network Price Prediction: Pi Shows Early Recovery Signals as Derivatives Activity Weakens
Moreover, the Bollinger Band %B indicator stands near 0.89. This reading places $PEPE close to its upper Bollinger Band. Although this reflects strong momentum, it also suggests limited room before potential consolidation.
Open Interest Shows Moderate Recovery in Derivatives Participation
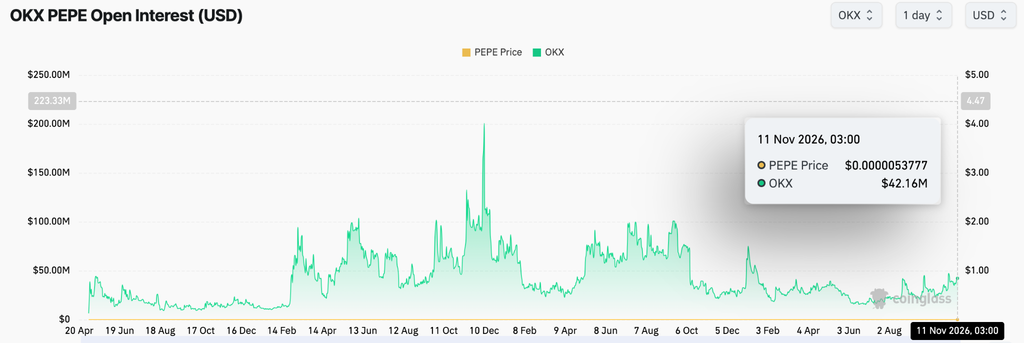
$PEPE’s derivatives market presents a mixed picture despite its bullish price structure. Open interest on OKX currently stands at $42.16 million as of November 11, 2026.
Historical readings reveal substantial changes in speculative participation. Open interest climbed sharply around February, reaching several peaks between $50 million and $100 million. The strongest expansion occurred around December, when the indicator briefly approached $200 million.
Source: Coinglass
However, participation declined considerably after that peak. Subsequent recoveries failed to reproduce similar levels of derivatives activity. Recently, open interest has stabilized between $30 million and $45 million.
This recovery suggests renewed interest in $PEPE futures. Nevertheless, current participation remains considerably below previous highs. Therefore, traders should monitor whether rising open interest accompanies stronger price performance.
A sustained increase could strengthen the case for another bullish move. Conversely, declining open interest could indicate weakening speculative demand.
Futures and Spot Outflows Highlight Weakening Buying Demand
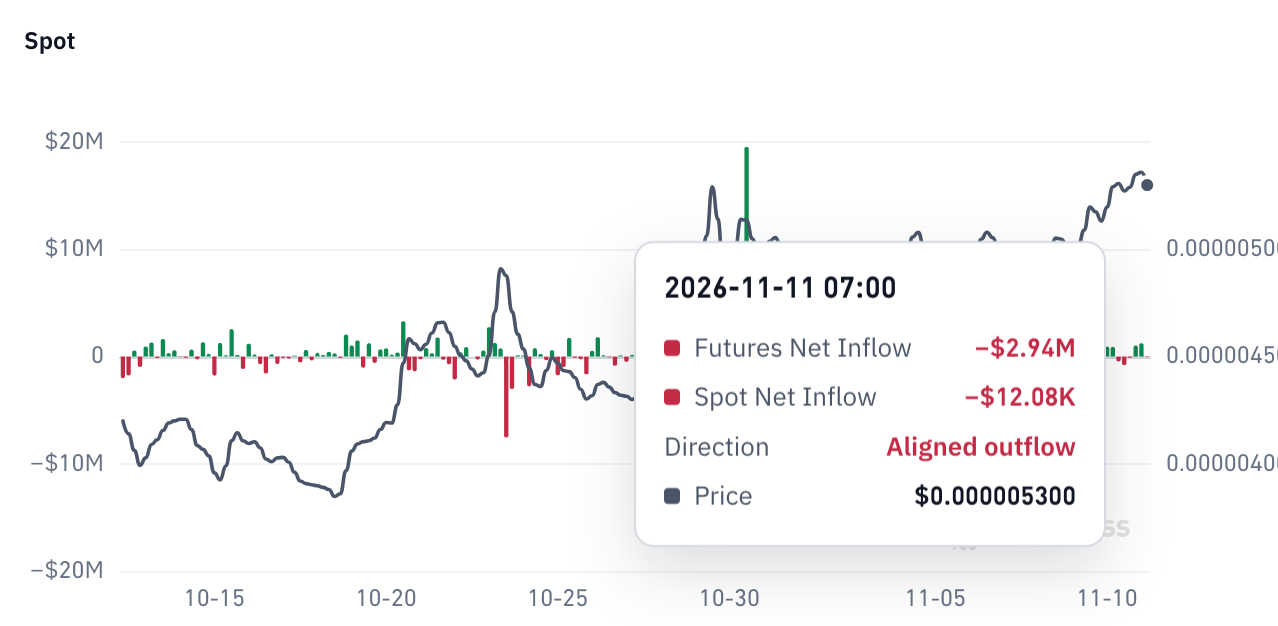
Capital flow indicators provide another warning for $PEPE’s short-term outlook. Both futures and spot markets recorded negative net flows on November 11.
Futures net outflows reached $2.94 million, suggesting that capital continues leaving derivatives positions. Additionally, spot net outflows stood at $12.08K, highlighting weaker demand across the underlying market.
Source: Coinglass
These movements indicate limited buying conviction despite $PEPE maintaining its bullish technical structure. Moreover, simultaneous outflows could restrict the strength of any recovery attempt.
Consequently, the market needs fresh capital inflows to support another sustained advance. Without renewed participation, resistance near $0.00000552 could continue limiting upward momentum.
Technical Outlook For Pepe Price
Key levels remain well-defined as $PEPE attempts to maintain its bullish daily structure:
Upside levels: $0.00000552 represents immediate resistance, followed by $0.00000580 as the next bullish target. A decisive breakout above these levels could strengthen upward momentum.
Downside levels: $0.00000513 serves as immediate support, followed by $0.00000474 and $0.00000445. A deeper correction could expose $0.00000415.
Dynamic support: The 20-day EMA at $0.0000048567 provides an important support level. Meanwhile, the 50-day EMA at $0.0000044888 offers another potential demand zone.
The technical picture suggests $PEPE maintains a bullish daily structure while approaching a critical resistance cluster. However, its Bollinger Band %B reading of 0.89 signals limited room before potential short-term consolidation. A breakout could encourage further volatility and attract renewed buying interest.
Will Pepe Go Up?
Pepe’s price prediction hinges on whether buyers can defend $0.00000513 and challenge resistance at $0.00000552. A successful breakout could open the way toward $0.00000580.
However, weakening futures and spot flows introduce uncertainty. Futures net outflows reached $2.94 million, while spot net outflows stood at $12,080 on November 11. Additionally, OKX open interest remains relatively moderate at $42.16 million.
If buying pressure strengthens alongside improving capital inflows, $PEPE could extend its recovery. Conversely, losing $0.00000513 risks exposing the $0.00000474 and $0.00000445 support levels.
For now, $PEPE remains at a pivotal technical zone. Its bullish EMA alignment supports optimism, but stronger market participation will determine whether buyers can sustain the next upward move.

 coinedition.com