Despite recent volatility, one of $XRP’s major long-term price targets has been reaching double digits at $10.
However, achieving this milestone would require several catalysts to come together and support a substantial rally.
To assess the likelihood, OpenAI’s ChatGPT has outlined its outlook for $XRP through 2030, identifying the year in which the cryptocurrency has the strongest chance of reaching the target.
Know when your coins move
Alerts, real-time prices, and market news — all in one app
Point your phone camera to install
4.8 based on 40K reviews in the App Store and Google Play
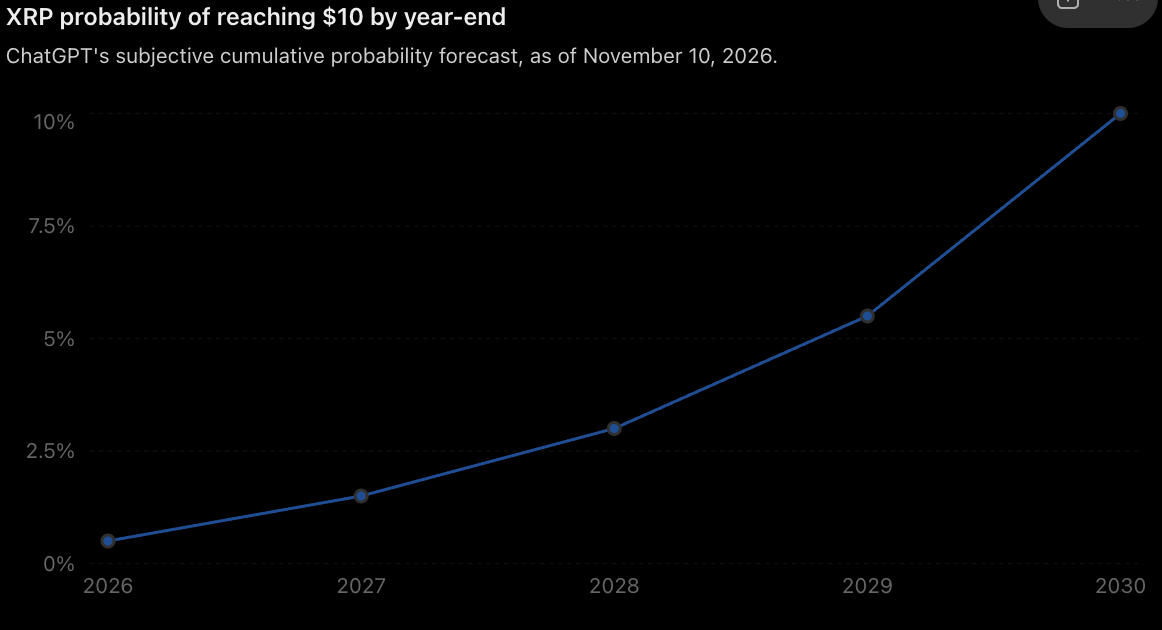
Notably, ChatGPT identifies 2030 as the most likely year for $XRP to reach $10, with the second half of the year representing the strongest potential window. However, it assigned the token a 4.5% probability of first hitting the target during that year.
The model estimates a 0.5% probability of $XRP reaching $10 during the remainder of 2026, followed by 1% in 2027, 1.5% in 2028, and 2.5% in 2029.
This probability rises to 4.5% in 2030, bringing the cumulative likelihood of $XRP reaching the target by December 31, 2030, to 10%.
$XRP price prediction to $10 probabilities. Source: ChatGPT
Therefore, this leaves a 90% probability that the cryptocurrency will not reach $10 within the forecast period.
What would it take for $XRP to reach $10?
At approximately $1.10 $XRP would need to gain over 800% to reach $10. Based on an estimated circulating supply of 63.52 billion tokens, that price would give the cryptocurrency a market capitalization of approximately $635.2 billion.
Such an increase would require substantial capital inflows, potentially supported by stronger institutional adoption, sustained demand for spot $XRP exchange-traded funds (ETFs), wider use of Ripple’s payment infrastructure and a prolonged cryptocurrency bull market.
However, weaker institutional demand, competition from other payment networks and digital assets, and broader market volatility could undermine the outlook.
$XRP price analysis
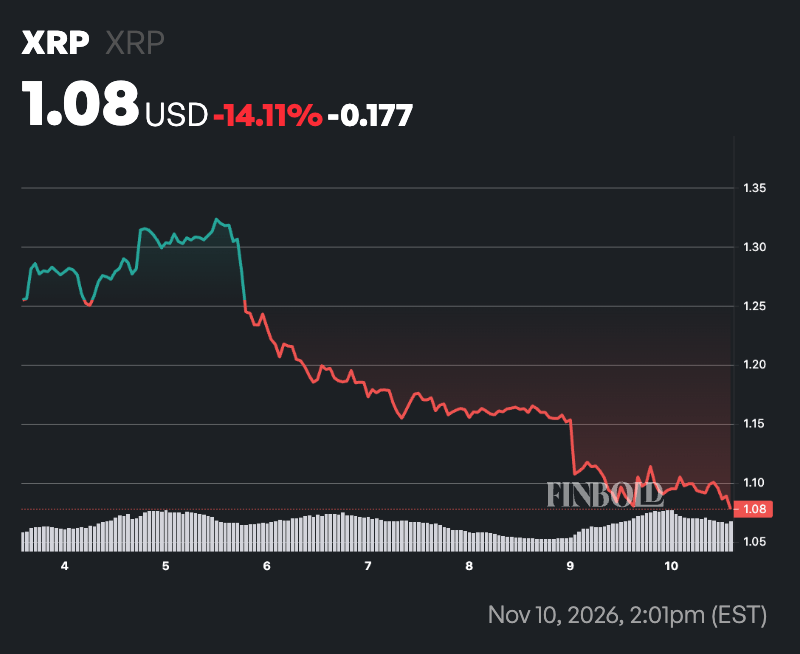
As of press time, $XRP was trading at $1.08, well below its 50-day simple moving average (SMA) of $1.37 and 200-day SMA of $1.27, indicating sustained bearish momentum.
$XRP seven-day price chart. Source: Finbold
The 50-day SMA remains above the 200-day SMA, while $XRP’s position below both averages points to weakening buying pressure.
Meanwhile, the 14-day relative strength index (RSI) stands at 26.51, placing $XRP in oversold territory.
This reflects strong selling pressure but could also leave room for a short-term relief rebound if buyers return.
However, the oversold reading does not confirm a reversal, meaning $XRP could remain under pressure until it reclaims the key moving averages.

 finbold.com