Why PI’s daily chart shows bears remain in control
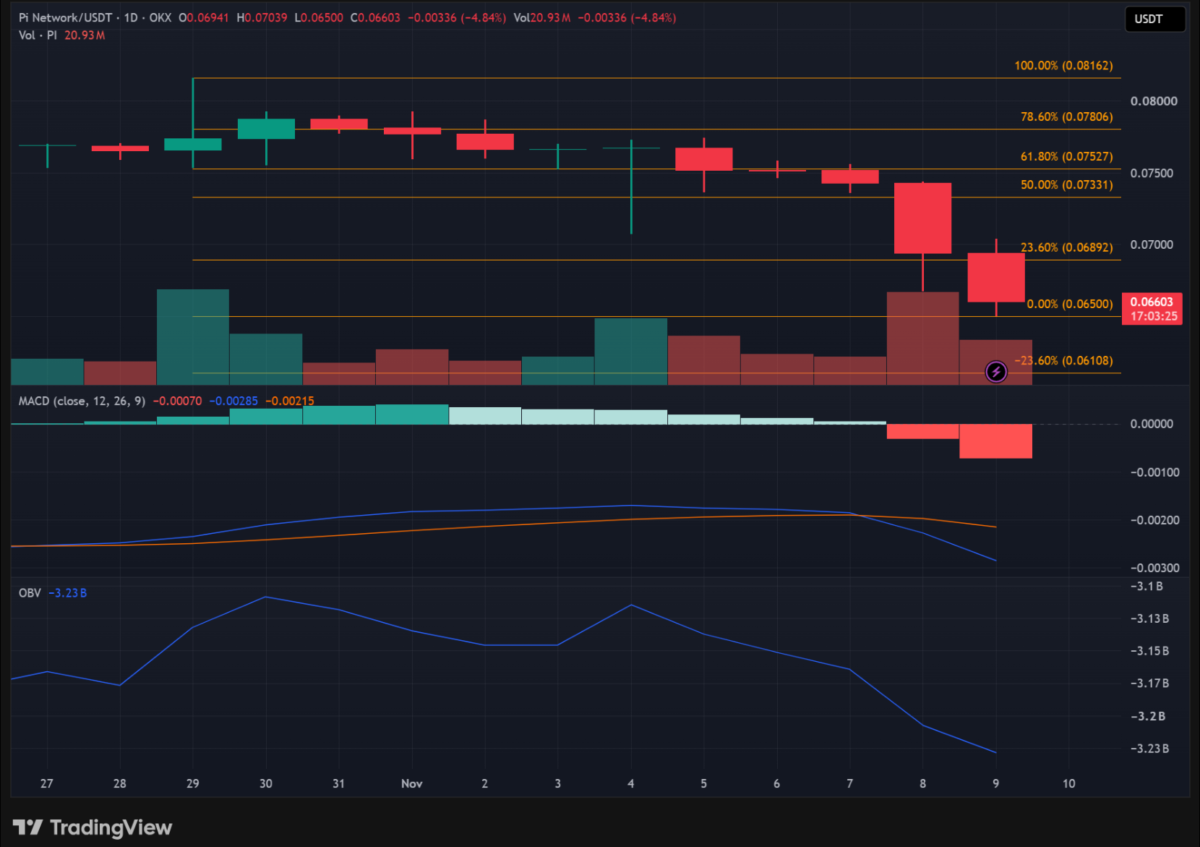
The daily chart highlighted the extent of PI’s bearish move. At the time of writing, PI was trading at $0.066, within the lower 0%–23.6% Fibonacci retracement zone. This made $0.065 a critical, immediate support level that traders need to watch for. The latest daily candle already tested this level before recovering slightly, although the recovery was limited. This left buyers with little room to absorb further selling pressure.
Additionally, the momentum indicators offered little encouragement for a recovery. The MACD remained below both its signal and zero lines, with the negative histogram expanding over the latest sessions. Furthermore, the OBV recorded a marked decline, a clear sign that buyers could not beat the sell pressure.
As a result, for traders, $0.065 is a key level to watch. Breaking below this level would cause PI to crash toward the -23.6% Fibonacci extension, near $0.061.
Final Summary
- Currently, PI remains firmly in the bearish camp – both the MACD and OBV indicators are stagnant.
- $0.065 is the immediate support to watch. A break below this level would expose PI to further losses down towards the $0.061 Fib extension.

 ambcrypto.com