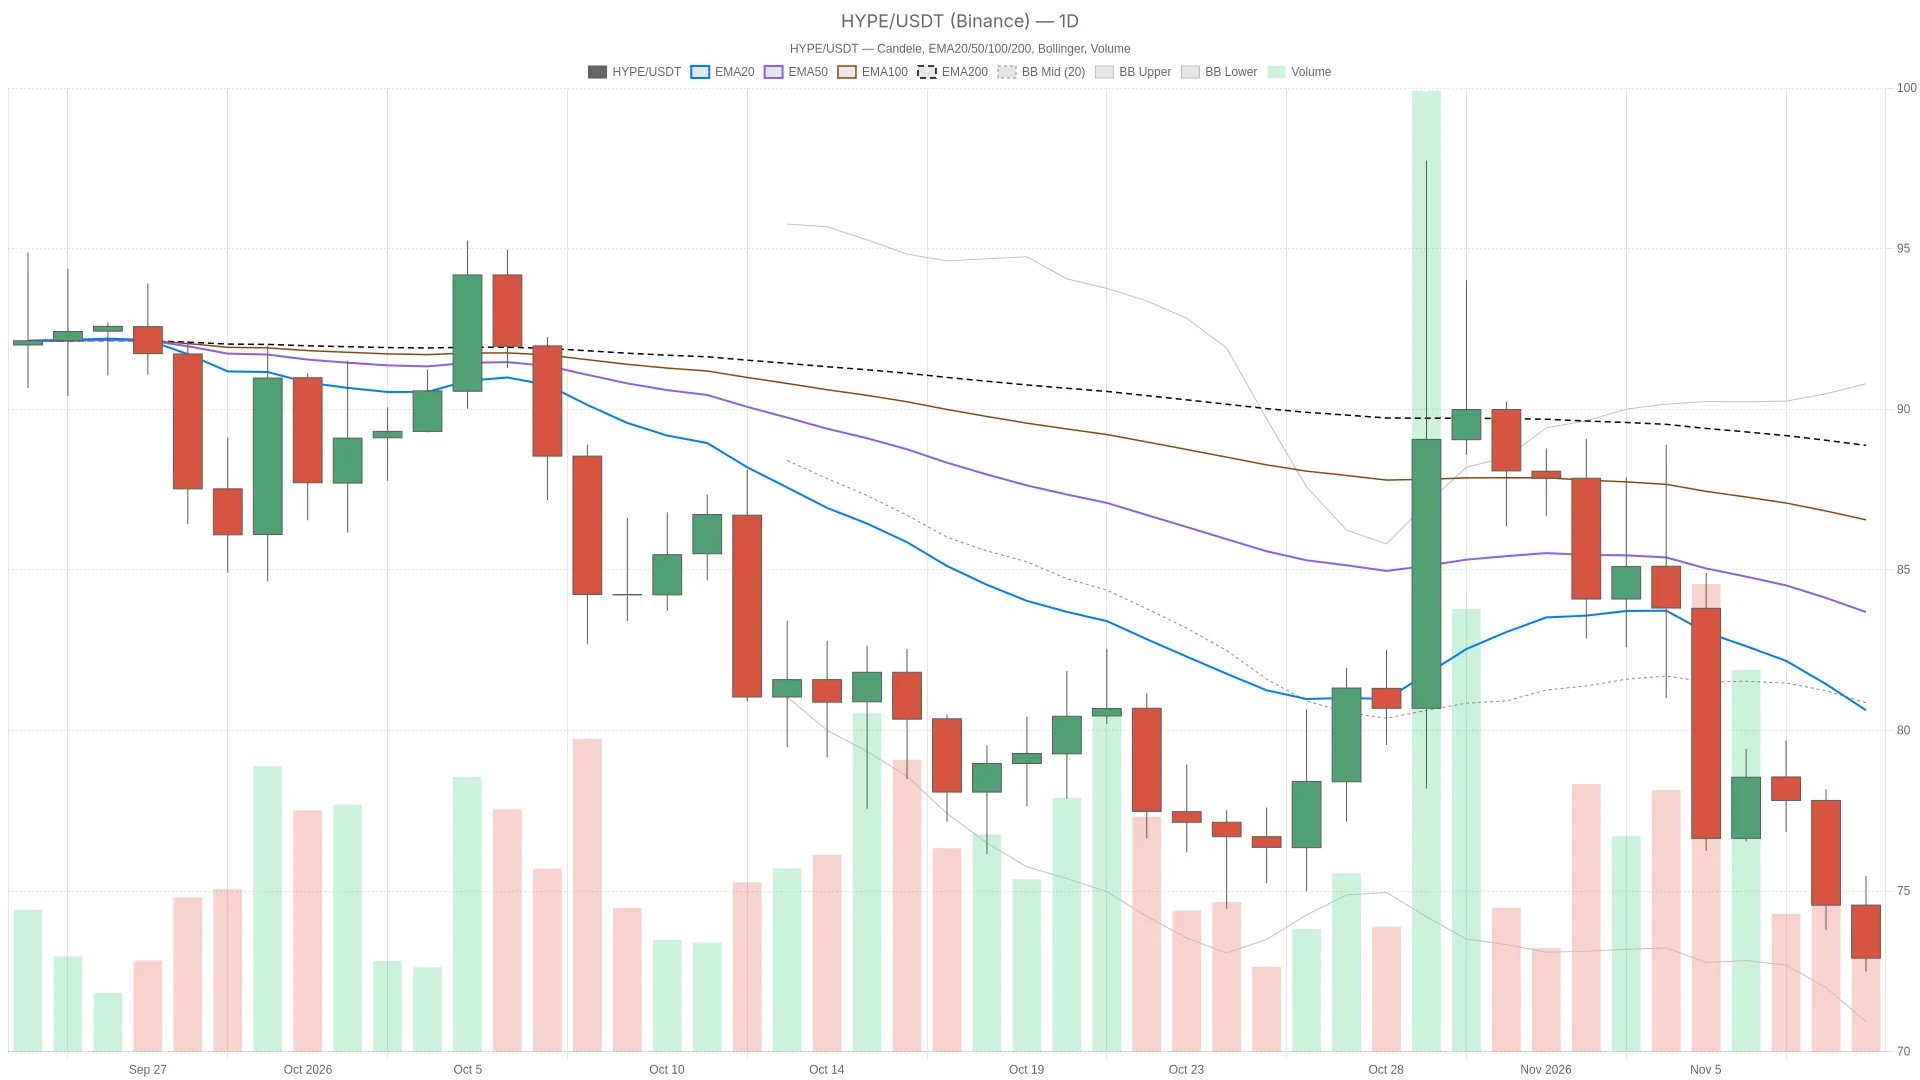
Hyperliquid price faces a daily downtrend with limited hourly relief
The daily downtrend remains in control, with no completed-candle recovery established on either the daily or hourly timeframe. The daily chart sets a bearish main scenario. $HYPE trades below its last completed daily close of $74.56, while the hourly price is also below its last completed close of $73.21. Those live readings are not completed-candle breakdowns, but they show that neither horizon has established a convincing recovery.
The tension is in momentum rather than trend direction: hourly selling momentum is less severe, yet the daily bearish impulse is strengthening. On the 15-minute chart, a positive momentum reading offers some rebound potential, but it does not outweigh the larger structure. In practice, the shorter charts describe a possible pause inside weakness rather than a confirmed reversal.
Bearish EMA alignment leaves rebounds below the trend structure
Across all timeframes, $HYPE sits below every major EMA, creating stacked overhead resistance that would contain any bounce. Binance candle data place $HYPE below the daily EMA20 at $81.44. On the hourly chart, price is below the EMA20 at $74.94, EMA50 at $76.37 and EMA200 at $80.30. Those hourly averages are bearishly aligned, so a modest bounce would still leave substantial overhead resistance.
Moreover, the 15-minute chart reinforces that structure: price is below its EMA20 at $73.59, EMA50 at $74.35 and EMA200 at $76.20, with bearish alignment there too. Execution-scale strength therefore needs confirmation; a brief upward move alone would not repair the trend.
Meanwhile, the daily Bollinger lower band at $71.99 lies beneath price, while the daily Bollinger midpoint at $81.24 and upper band at $90.48 sit well above it. Trading near the lower boundary is consistent with downside pressure, not automatic evidence of a bottom. Daily ATR is $4.94, underscoring that nearby levels can be crossed within an ordinary daily trading range.
RSI remains weak while MACD gives conflicting short-term signals
Momentum indicators confirm bearish control on the daily chart, while the smallest timeframe offers only a fading positive signal. Daily RSI is 35.9 and falling, supporting the bearish bias without reaching oversold territory. Hourly RSI is 32.7, approaching that threshold, but its recent readings are mixed. The 15-minute RSI stands at 39.2 with flat recent direction. Together, these readings show weak momentum without a coordinated recovery across horizons.
The daily MACD histogram is negative and widening, reinforcing the case that downside momentum remains active. However, the hourly histogram is also negative but narrowing across the supplied completed readings: selling momentum has eased, though it has not turned positive.
On the smallest timeframe, the 15-minute MACD histogram is positive but falling and narrowing. That distinction matters: the smallest chart has a bullish momentum reading, yet its strength is fading. It is not a reliable counterweight to the daily signal.
Support near $72.84 separates a rebound attempt from further downside
The $72.84–$72.85 zone is the immediate floor. A daily close below it would confirm bearish continuation, while an hourly close above $73.56 opens a limited rebound path. Specifically, the nearest supports are hourly S1 at $72.85 and daily S1 at $72.84. They are close, but not identical. Above price, the hourly pivot at $73.56 is the first recovery hurdle, followed by hourly R1 at $73.92. The daily pivot at $75.50 remains a larger barrier, with daily R1 at $77.22 beyond it.
Bullish scenario: An hourly close above the hourly pivot at $73.56 would activate a rebound case toward hourly R1 at $73.92. The hourly EMA20 at $74.94 would be the next structural test. An hourly close below hourly S1 at $72.85 would invalidate that rebound setup. This would initially be a countertrend recovery, not a change in the daily bias.
Bearish scenario: A daily close below daily S1 at $72.84 would confirm a loss of nearby daily support. It would expose the daily Bollinger lower band at $71.99. A subsequent daily close above the daily pivot at $75.50 would invalidate that continuation setup. The hourly Bollinger lower band at $72.37 provides an intermediate reference below current price.
The likeliest false signal in this reading is a brief recovery through the hourly pivot that fails to hold on a completed candle. The fading positive 15-minute MACD makes that risk relevant. Conversely, an intraday dip beneath support without the specified daily close would not confirm the bearish scenario. The daily ATR leaves room for substantial noise around these tightly spaced levels.
Broker-registration plans do not establish a price catalyst
Separately, the broker-registration effort does not provide a direct price catalyst for $HYPE. Hyperliquid Strategies is seeking US futures broker registration for perpetuals. That provides business context, but the supplied information does not establish a connection between the registration effort and $HYPE’s current move. The technical recovery case still depends on price confirmation rather than the headline alone.
Fear and a shrinking crypto market frame the defensive backdrop
Meanwhile, broader market conditions are defensive and offer no tailwind for a $HYPE recovery. The Fear & Greed Index reads 29, classified as Fear. CoinGecko reports total crypto market capitalization of $2.47 trillion, down 5.04% over 24 hours, with Bitcoin dominance at 60.19%. This is a defensive broader-market backdrop, although it does not establish the cause of $HYPE’s weakness.
FAQ
Is $HYPE oversold?
Not on the current RSI readings: daily RSI is 35.9, hourly RSI is 32.7 and 15-minute RSI is 39.2. All remain above 30.
Would an hourly rebound reverse the daily outlook?
No. The bullish scenario is initially countertrend; an hourly pivot recovery would not by itself repair the bearish daily structure.
What is the key level to watch for a bearish breakdown?
A daily close below $72.84 (daily S1) would confirm the bearish continuation and expose the daily Bollinger lower band at $71.99.
Disclaimer: This article is for informational purposes only and does not constitute financial advice, an investment recommendation, or a solicitation to buy or sell any financial instrument or cryptocurrency. The analysis provided is not indicative of future results. Investing in crypto assets and financial markets carries a high risk of capital loss. Always do your own research (DYOR) and consult a qualified financial advisor before making any decision.
Article produced with the assistance of artificial intelligence and reviewed by the editorial team.

 en.cryptonomist.ch