XRP Long-Term VHD Pattern Projects Path to $17, $27, and $48
thecryptobasic.com
5 h
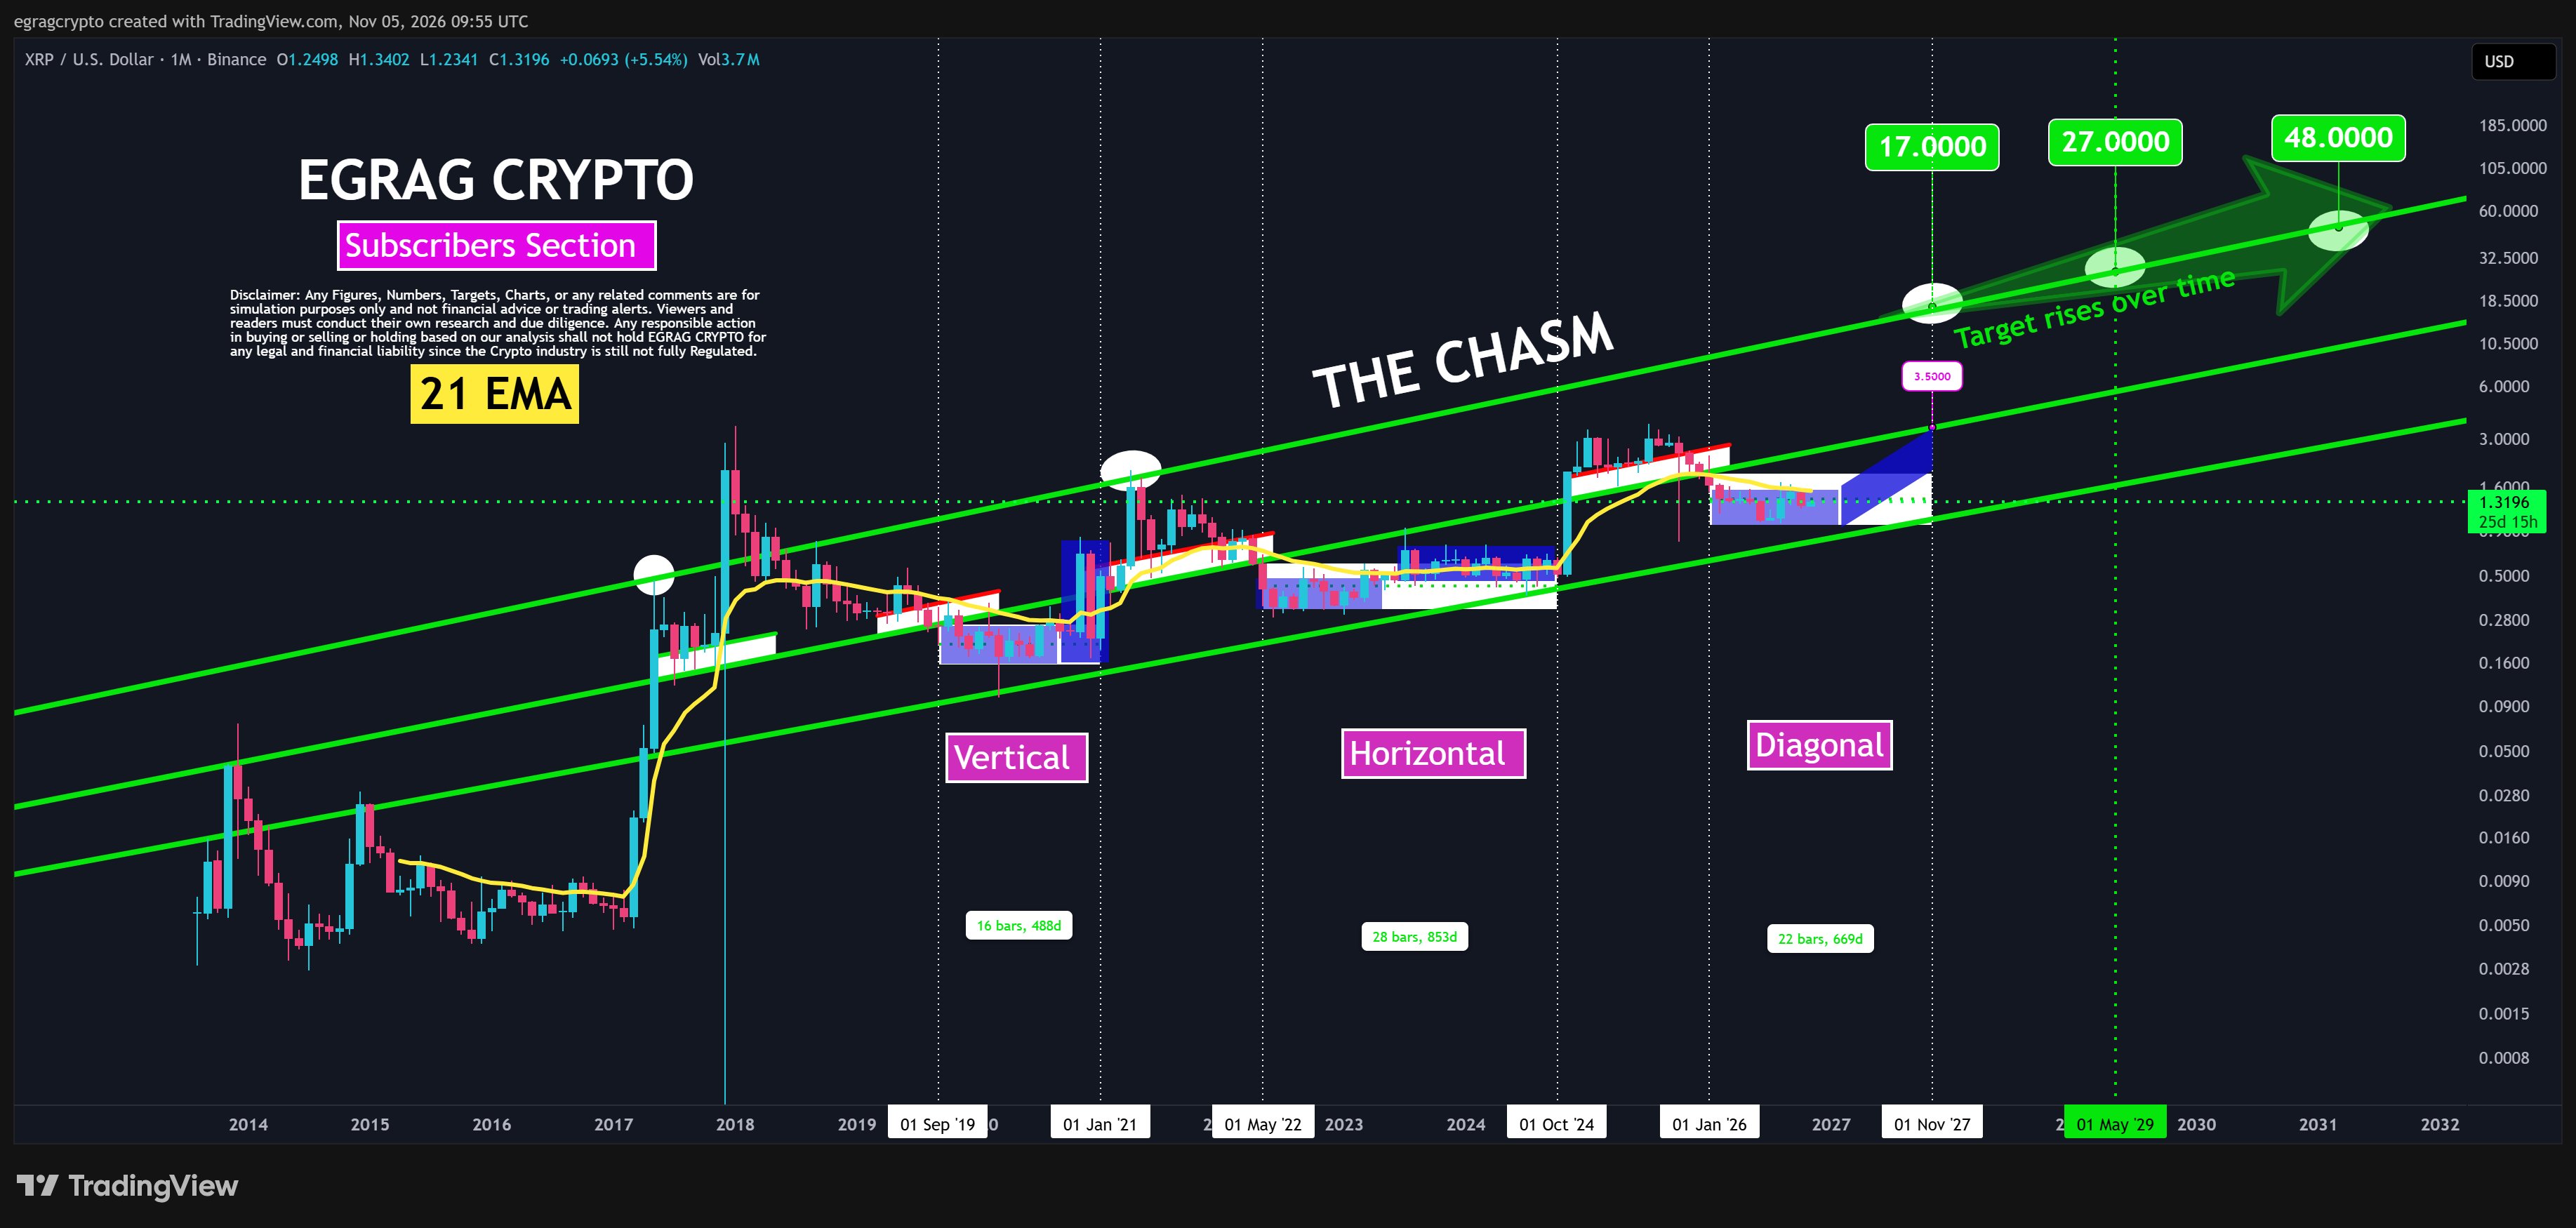
Crypto analyst EGRAG has identified a long-term pattern on the $XRP monthly chart that leads to possible price targets of $17, $27, and $48.
He calls this the Vertical-Horizontal-Diagonal (VHD) Theory, which describes three phases $XRP has moved through before previous major price rallies. The current phase has now lasted 22 monthly bars, and EGRAG believes it could be leading to another major expansion.
The theory considers how $XRP behaves during accumulation periods before a major rally. These periods take three forms: a sharp vertical move, an extended sideways phase, and a gradual upward structure.
Know when your coins move
Alerts, real-time prices, and market news — all in one app
Point your phone camera to install
4.8 based on 40K reviews in the App Store and Google Play
EGRAG suggests that the duration and relationship between these phases could explain $XRP’s broader market cycles.
$XRP’s First Two VHD Phases Led to Major Price Expansions
The first phase, which EGRAG identifies as Vertical, lasted 16 monthly bars, equivalent to 488 days. During this period, $XRP traded below its 21-period Exponential Moving Average (EMA) while the market went through an accumulation period.
The structure eventually ended with a sudden upward breakout that preceded $XRP’s major rally in 2017.
The second phase, called Horizontal, followed a different pattern. It lasted 28 monthly bars, or 853 days, as $XRP traded sideways beneath and around the 21 EMA.
In this phase, the market did not break out immediately but spent an extended period consolidating before another major price expansion during the 2019-2021 cycle.
This second occurrence showed that $XRP could go through a much longer accumulation period before making another significant move.
$XRP’s Current Diagonal Structure Reaches 669 Days
The third phase, which EGRAG calls Diagonal, is currently underway and has lasted 22 monthly bars, or 669 days. Unlike the previous two phases, $XRP is not moving within a flat consolidation range.
$XRP VHD pattern projects path to $17, $27, and $48
Its monthly chart instead shows an ascending channel, with each new swing low forming above the previous one. This suggests that buyers are gradually accepting higher prices instead of waiting for the market to return to an established support level.
However, the duration of this phase makes the current position particularly interesting. The first two phases lasted 488 days and 853 days, respectively. When averaged, their combined duration produces 670.5 days.
This is almost identical to the 669 days recorded in the current Diagonal phase, which leaves a difference of just 1.5 days. EGRAG acknowledged that the similarity could be coincidental but said the timing alignment is worth watching.
The rising channel also separates the current structure from the earlier accumulation periods. Instead of moving sideways, $XRP continues to establish higher lows, showing a gradual shift in the prices at which buyers are willing to enter.
If this structure holds, it could provide the foundation for another expansion. However, the market must first overcome several important resistance levels.
$1.55 Remains $XRP’s First Major Confirmation Level
EGRAG’s near-term roadmap begins at $1.55, which aligns with the 21 EMA on the monthly chart. $XRP needs to reclaim this level and maintain a monthly close above it to provide the first meaningful confirmation of the bullish structure.
The indicator has influenced $XRP’s broader trend across several market cycles, and this makes its current position important to the VHD outlook.
Above $1.55, the next major resistance stands at $2.60. A successful move through this level could open the way toward $3.50, which EGRAG identifies as the expansion target for the current Diagonal phase.
However, he sees $3.50 as a possible intermediate level, not the end of the rally. The larger projections of $17, $27, and $48 depend on the broader structure continuing beyond this initial expansion.
The Chasm Establishes $XRP’s $17, $27, and $48 Projections
EGRAG bases his long-term targets on a structure he calls The Chasm. It describes the widening gap between $XRP’s current price and the upper boundary of a green macro trendline channel that has been visible on the monthly chart since 2014.
Because this upper boundary continues to rise over time, the projected targets depend on when $XRP reaches it rather than remaining fixed at one price.
Using the projected channel intersections, EGRAG places $XRP at $17 in 2027, $27 in 2029, and $48 in 2031. However, these figures are speculative and do not guarantee that $XRP will reach those levels.

 thecryptobasic.com