Crypto Price Analysis, BTC, ETH, NEAR, ENA and ZEC, Nov. 5: Bitcoin Reclaims Daily Averages as Ethereum Confirms MACD Crossover
thecryptobasic.com
2 h
Bitcoin reclaims daily averages as Ethereum confirms a bullish MACD crossover. November 5 analysis covers $BTC, $ETH, $NEAR, $ENA and $ZEC with key chart levels.
Asset
Latest USD price
Past 24 hours
24-hour market volume
Market-cap rank
Bitcoin ($BTC)
$80,491
+5.37%
$37.37 billion
1
Ethereum ($ETH)
$2,423.36
+7.91%
$16.46 billion
2
$NEAR Protocol ($NEAR)
$4.04
+7.91%
$742.55 million
21
Ethena ($ENA)
$0.181444
+7.41%
$428.70 million
41
Zcash ($ZEC)
$1,312.37
+10.79%
$1.24 billion
10
Bitcoin Reclaims Both Daily Averages After a Sharp Reversal
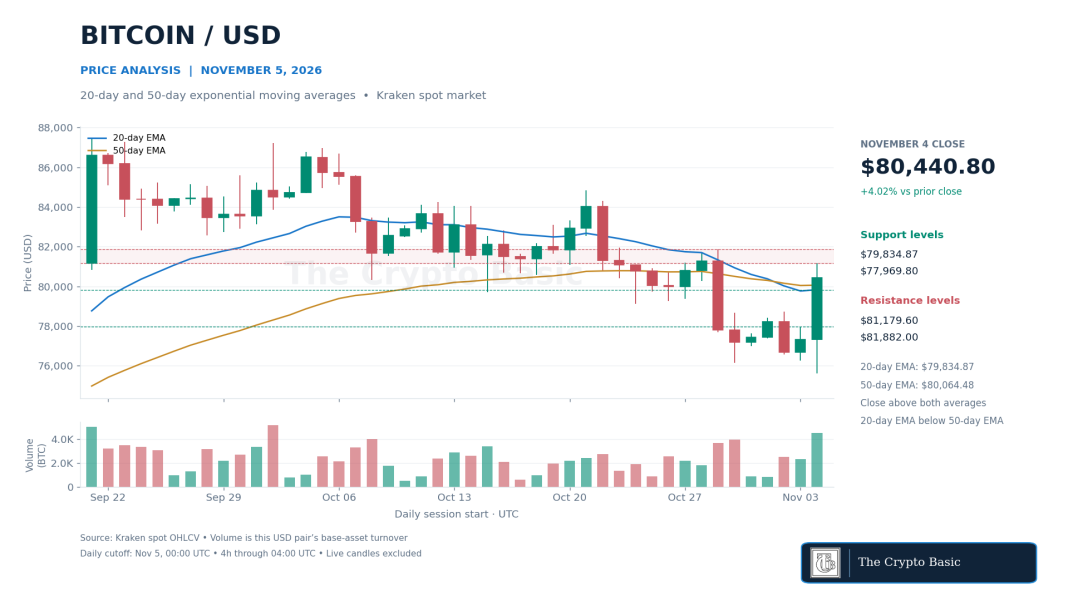
Bitcoin closed Wednesday at $80,440.80, gaining 4.02%, after trading between $75,625 and $81,179.60. It undercut October 30’s $76,155.50 low intraday but recovered above Tuesday’s $77,969.80 high at the close. The session therefore produced a strong reversal rather than a confirmed daily breakdown beneath the October low.
Know when your coins move
Alerts, real-time prices, and market news — all in one app
Point your phone camera to install
4.8 based on 40K reviews in the App Store and Google Play
$BTC/USD closes above its 20-day and 50-day EMAs after reversing from $75,625; $81,179.60 and $81,882 remain overhead.
That repairs the lost weekend support described in our November 3 analysis. The latest price also remained above $80,000, although Wednesday’s high had not been cleared.
The 20-day exponential moving average turned higher to $79,834.87 from $79,771.09. The 50-day EMA also rose, reaching $80,064.48. Price closed above both, but the faster average remained below the slower one. The price reclaim is confirmed; a bullish moving-average crossover is not.
The last completed four-hour candle closed at $80,469.50, maintaining the recovery above both daily averages. Holding the $79,835–$80,064 area would support another test of $81,179.60. A daily close above that high would strengthen the advance toward October 29’s $81,882 high.
Losing the averages would weaken the reclaim and expose $77,969.80. A daily close below Wednesday’s $75,625 low would invalidate the reversal and bring September 15’s $74,891.50 low back into focus.
Ethereum Confirms a Bullish Daily MACD Crossover
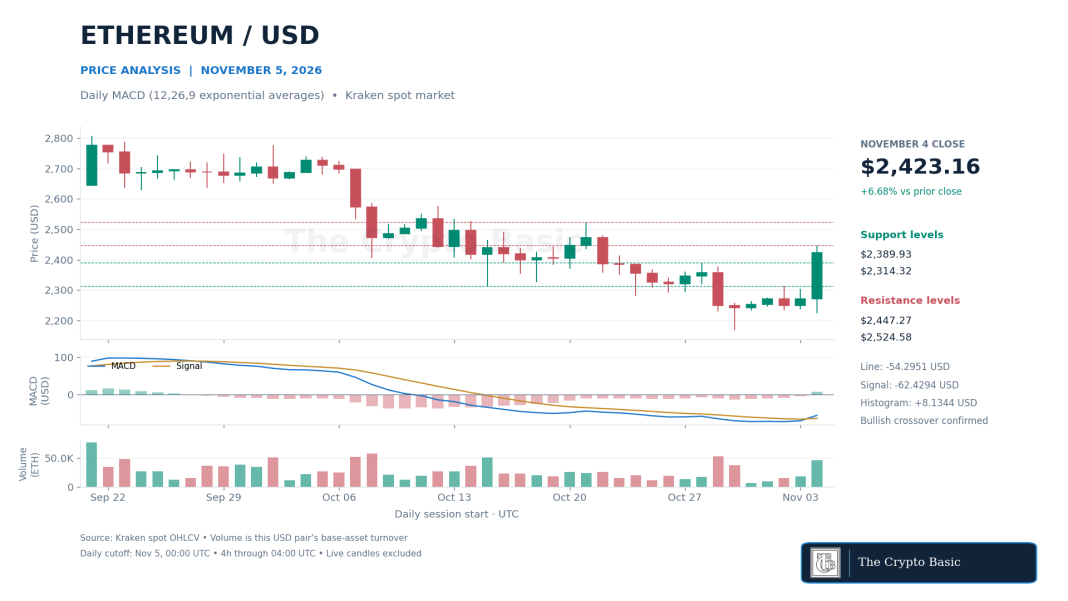
Ethereum closed Wednesday at $2,423.16, up 6.68%, after reaching $2,447.27 and finding support at $2,223.35. The close cleared $2,279.80, $2,314.32 and $2,319.54, the recovery thresholds discussed in Wednesday’s price analysis. The latest $2,423.36 price was 7.99% above the price recorded in that report.
$ETH/USD confirms a bullish MACD crossover on Wednesday’s completed candle, with the histogram turning positive at +8.13.
Daily MACD, calculated with 12- and 26-period exponential averages and a nine-period signal EMA, now confirms a bullish line-signal crossover. The MACD line rose to −54.30, above the −62.43 signal. Its histogram changed from −4.37 to +8.13 on the completed Wednesday candle.
This is more than a narrowing bearish histogram. The line has crossed its signal, although both remain below zero, indicating that the improvement is still developing within a recovery from the preceding decline. Four-hour momentum was also positive: the latest completed histogram stood at +19.07.
A daily close above $2,447.27 would extend the breakout and put October 21’s $2,524.58 high in view. Holding the reclaimed October 28 high at $2,389.93 would preserve a nearby support reference. A return below $2,314.32 would weaken the breakout materially. Losing Wednesday’s $2,223.35 low would overturn the latest reversal, while a daily close below $2,170 would invalidate the broader recovery base.
$NEAR Recovers $3.90 but RSI Remains Below Neutral
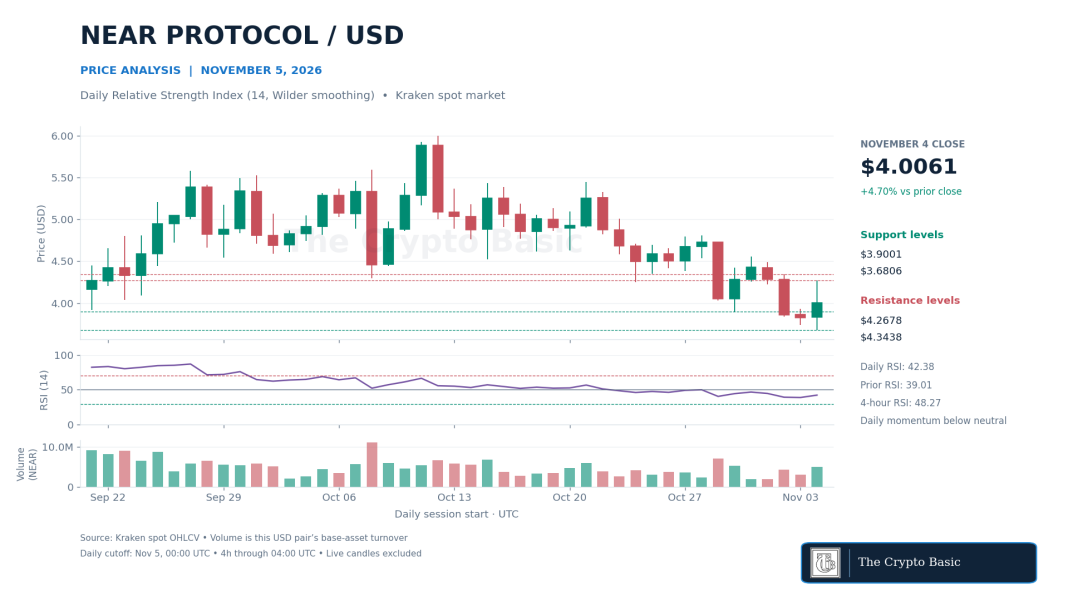
$NEAR closed Wednesday at $4.0061, gaining 4.70%, after a wide $3.6806–$4.2678 session. The low was the weakest price in the latest 30 completed daily sessions. Buyers subsequently recovered Tuesday’s $3.9337 high and the $3.9001 floor lost earlier in the week, but the close remained well below the session high.
$NEAR/USD recovers above $3.9001 after a new 30-session low, while daily RSI rises to 42.38 but remains below neutral.
The daily 14-period RSI, using Wilder smoothing, rose to 42.38 from 39.01. Momentum improved without crossing the neutral 50 threshold. The latest completed four-hour RSI was 48.27, also below neutral, despite a closing price of $4.0340.
That leaves $NEAR in a recovery phase rather than a fully established bullish trend. Its 7.91% gain over the past 24 hours still accompanied a 9.45% decline over seven days. The shorter rebound has recovered only part of the weekly loss.
A daily close above $4.0333 would reclaim another former support, followed by Wednesday’s $4.2678 high. Clearing that high would strengthen the rebound toward Monday’s $4.3438 high. Conversely, falling back below $3.9337 and $3.9001 would challenge the latest reclaim, with $3.7385 next. A daily close below $3.6806 would invalidate Wednesday’s reversal and confirm another extension of the recent decline.
Ethena Rebounds Inside Its Daily Bollinger Bands
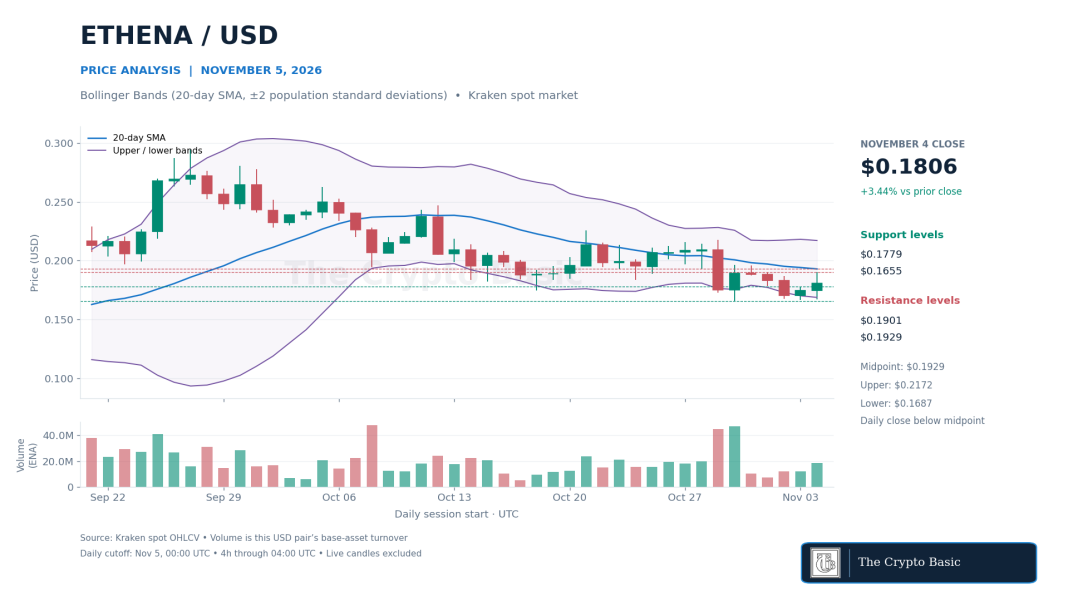
Ethena closed Wednesday at $0.1806, rising 3.44%, after trading between $0.1670 and $0.1901. The session formed a higher high and higher low than Tuesday and closed above Tuesday’s $0.1779 high. However, the advance stopped at the same $0.1901 high recorded on November 1.
$ENA/USD closes back inside its daily Bollinger envelope but remains below the falling $0.19294 midpoint and repeated $0.1901 resistance.
Daily Bollinger Bands, using a 20-day simple moving average and two population standard deviations, placed the midpoint at $0.19294. That midpoint fell from $0.19414, leaving the recovery beneath a declining daily trend reference. The lower band stood at $0.16871 and the upper band at $0.21717.
Wednesday’s low fell beneath the final daily lower-band value, but the close finished back inside the envelope. That distinction matters: the session did not confirm a closing break below the lower band. The latest completed four-hour close of $0.1816 was above its own $0.17631 midpoint, showing a firmer short-term picture.
A daily close above $0.1901 would clear the repeated resistance, with the daily midpoint and October 30’s $0.1965 high next. Losing $0.1779 would weaken the recent breakout. Support then sits at $0.1670 and $0.1665; a daily close beneath October 30’s $0.1655 low would invalidate the rebound. Band values will adjust as new candles close.
Zcash Advances on More Than Twice Its Recent Average Volume
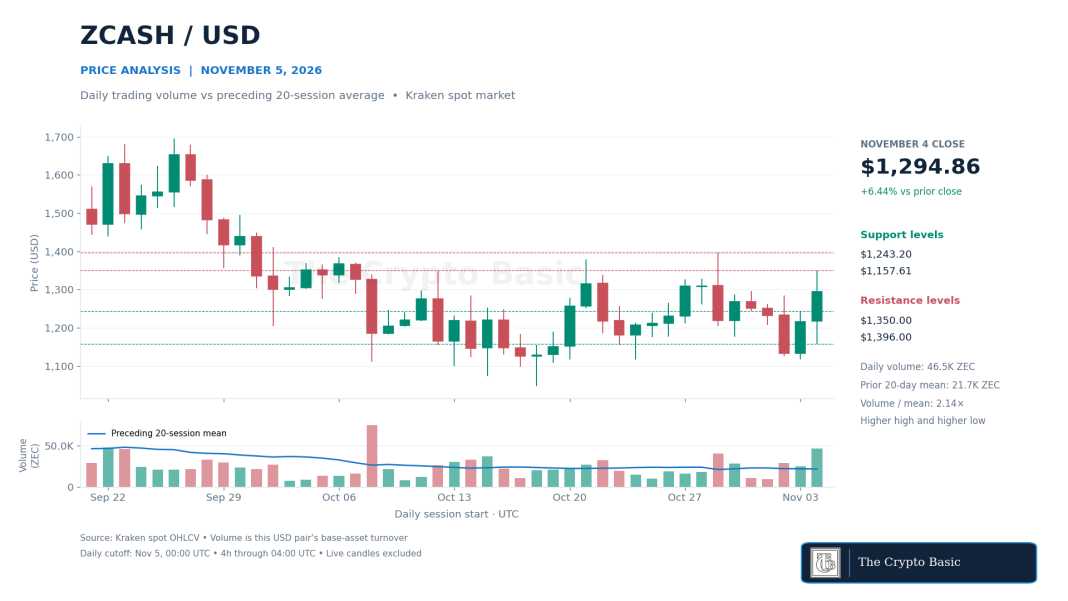
Zcash closed Wednesday at $1,294.86, gaining 6.44%, after reaching $1,350 and finding support at $1,157.61. The session produced a higher high and higher low than Tuesday and closed above Tuesday’s $1,243.20 high. It nevertheless finished just below October 31’s $1,296.85 high.
$ZEC/USD advances 6.44% on volume 114% above its preceding 20-session average, with $1,350 and $1,396 as the next resistance levels.
Daily turnover reached approximately 46,542 $ZEC, compared with a preceding 20-session average of 21,720 $ZEC. Participation was therefore 2.14 times that benchmark, or about 114% above average. The price advance attracted substantially more trading than a typical recent session, supporting the breakout observation without establishing that the next resistance will clear.
The latest completed four-hour candle closed at $1,311.28, above $1,296.85. That confirms a shorter-timeframe reclaim of the level, while the daily chart still awaits a close above it. The latest market price of $1,312.37 remained below Wednesday’s high.
A daily close above $1,350 would strengthen the recovery toward October 29’s $1,396 high. Holding $1,243.20 would preserve the latest daily breakout. A return beneath that level would expose Wednesday’s $1,157.61 low, followed by Tuesday’s $1,117.06 low. A daily close below $1,117.06 would invalidate the two-session recovery despite its stronger participation.

 thecryptobasic.com