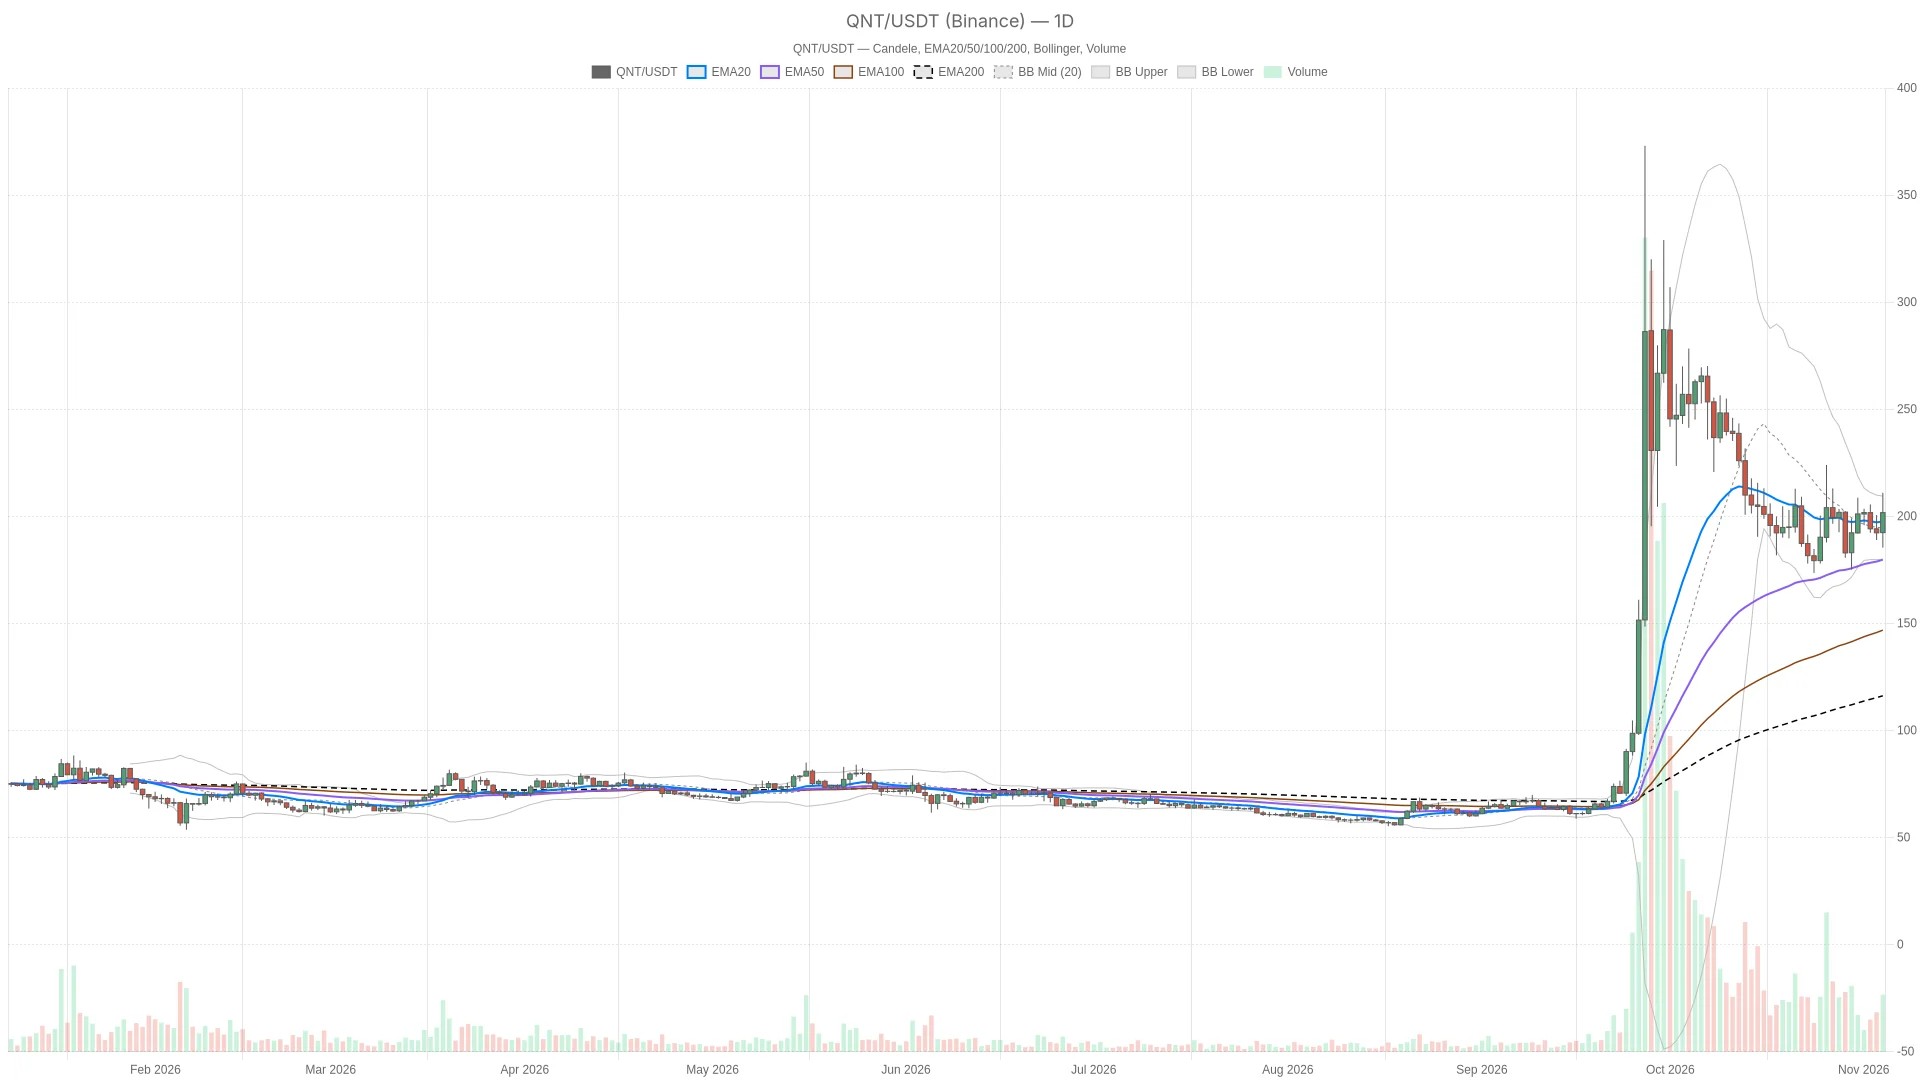
Quant price faces an hourly decision between $201.17 and $203.24
The hourly chart presents a clear binary: a close above $203.24 confirms a local recovery, while a close below $201.17 favors a deeper retracement. The nearest resistance is the hourly pivot at $203.24, followed by hourly R1 at $204.37. The hourly snapshot trades at $201.60, below both levels, while hourly S1 at $201.17 is the nearest support. The last completed hourly candle closed at $202.31, so neither directional trigger has already been met.
Bullish scenario: an hourly close above the hourly pivot at $203.24 would confirm a local recovery, bringing hourly R1 at $204.37 into focus. Beyond that sits the hourly Bollinger upper band at $208.63. An hourly close below hourly S1 at $201.17 would invalidate this recovery setup.
Bearish scenario: an hourly close below hourly S1 at $201.17 would favor a deeper retracement toward the hourly EMA20 at $199.34 and then daily R1 at $198.94. An hourly close back above the hourly pivot at $203.24 would invalidate that bearish setup. This would initially be a countertrend move, not proof that the daily bullish structure has failed.
Daily R1 at $198.94 is already below the live price and therefore acts as support, not an outstanding resistance trigger. Farther down, the daily pivot at $193.90 marks a deeper structural reference. Daily ATR is $19.87 against hourly ATR of $4.02: volatility leaves room for meaningful intraday swings without resolving the daily trend. The likeliest false signal is a brief push above the hourly pivot that fails to hold on a completed hourly candle.
Falling RSI and a narrowing hourly MACD temper the bullish bias
Momentum indicators across all timeframes fail to confirm the bullish structure, with the daily RSI declining and the hourly MACD losing steam.
RSI shows the recovery lacks broad momentum agreement
Daily RSI is 48.6 and falling across the last three completed readings. That is a weak foundation for strong bullish conviction despite the favorable trend structure. Hourly RSI is also falling, at 57.5: momentum remains above its midpoint, but its direction weakens the confirmation case.
The 15-minute RSI is 47.9 and falling. For execution context, that favors caution about treating an intraday bounce as a renewed trend advance. None of these readings is overbought or oversold.
MACD separates positive hourly momentum from immediate downside pressure
The daily MACD histogram is negative and broadly flat across the supplied readings, leaving momentum at odds with the bullish daily structure. The hourly histogram remains positive but is narrowing, so the recovery has positive momentum without fresh acceleration.
On the 15-minute chart, the negative histogram is widening. That is the clearest immediate weakness in the snapshot, though it does not by itself overturn the daily bias.
Aligned moving averages favor trend support over a confirmed reversal
Despite weakening momentum, the bullish alignment of daily and hourly moving averages keeps the broader structure constructive rather than bearish. Daily price is above the EMA20 at $197.15, EMA50 at $178.84 and EMA200 at $115.30, with the averages in bullish order. The hourly chart also trades above all three averages, which are bullishly aligned. These structures keep the broader reading constructive even as momentum softens.
The 15-minute price is below its EMA20 at $203.46 but above its EMA50 at $200.95 and EMA200 at $197.25. Its averages remain bullishly aligned, making this a short-term price retreat within a still-positive moving-average structure rather than a fully aligned bearish setup.
On the daily chart, price is above the Bollinger midpoint at $194.80 and below the upper band at $209.86. That leaves room within the daily envelope, but room is not confirmation. The 15-minute snapshot at $201.49 sits near its lower band at $201.26, reinforcing the immediate pullback reading.
Earlier $QNT coverage also highlighted missing confirmation
A prior assessment from November 2, 2026 identified the same disconnect between favorable structure and absent momentum confirmation that persists today. The November 2 $QNT assessment described a bullish trend lacking confirmation. The current technical split keeps that distinction relevant: favorable structure and convincing momentum are not the same thing.
Fear at 34 gives the bullish setup a cautious backdrop
Market sentiment at 34 (Fear) argues against assuming broad risk appetite will automatically validate $QNT’s bullish structure. Alternative.me’s Fear & Greed Index reads 34, classified as Fear. CoinGecko places total crypto market capitalization at $2,696,616,127,065.09 and Bitcoin dominance at 59.54%. These are market context, not evidence of a $QNT-specific catalyst; the sentiment reading argues against assuming broad risk appetite will validate the bullish structure.
FAQ
Is the quoted $QNT price a completed daily close?
No. The $201.71 daily snapshot is a live candle price. The last completed daily candle closed at $192.26, while the indicators use completed candles.
Does the weaker 15-minute chart make the main scenario bearish?
No. It supplies execution context. The daily chart defines the bullish bias, while the hourly support and resistance triggers determine whether the immediate move confirms a recovery or a deeper retracement.
{“@context”:”https://schema.org”,”@type”:”FAQPage”,”mainEntity”:[{“@type”:”Question”,”name”:”Is the quoted $QNT price a completed daily close?”,”acceptedAnswer”:{“@type”:”Answer”,”text”:”No. The $201.71 daily snapshot is a live candle price. The last completed daily candle closed at $192.26, while the indicators use completed candles.”}},{“@type”:”Question”,”name”:”Does the weaker 15-minute chart make the main scenario bearish?”,”acceptedAnswer”:{“@type”:”Answer”,”text”:”No. It supplies execution context. The daily chart defines the bullish bias, while the hourly support and resistance triggers determine whether the immediate move confirms a recovery or a deeper retracement.”}}]}
Disclaimer: This article is for informational purposes only and does not constitute financial advice, an investment recommendation, or a solicitation to buy or sell any financial instrument or cryptocurrency. The analysis provided is not indicative of future results. Investing in crypto assets and financial markets carries a high risk of capital loss. Always do your own research (DYOR) and consult a qualified financial advisor before making any decision.
Article produced with the assistance of artificial intelligence and reviewed by the editorial team.

 en.cryptonomist.ch