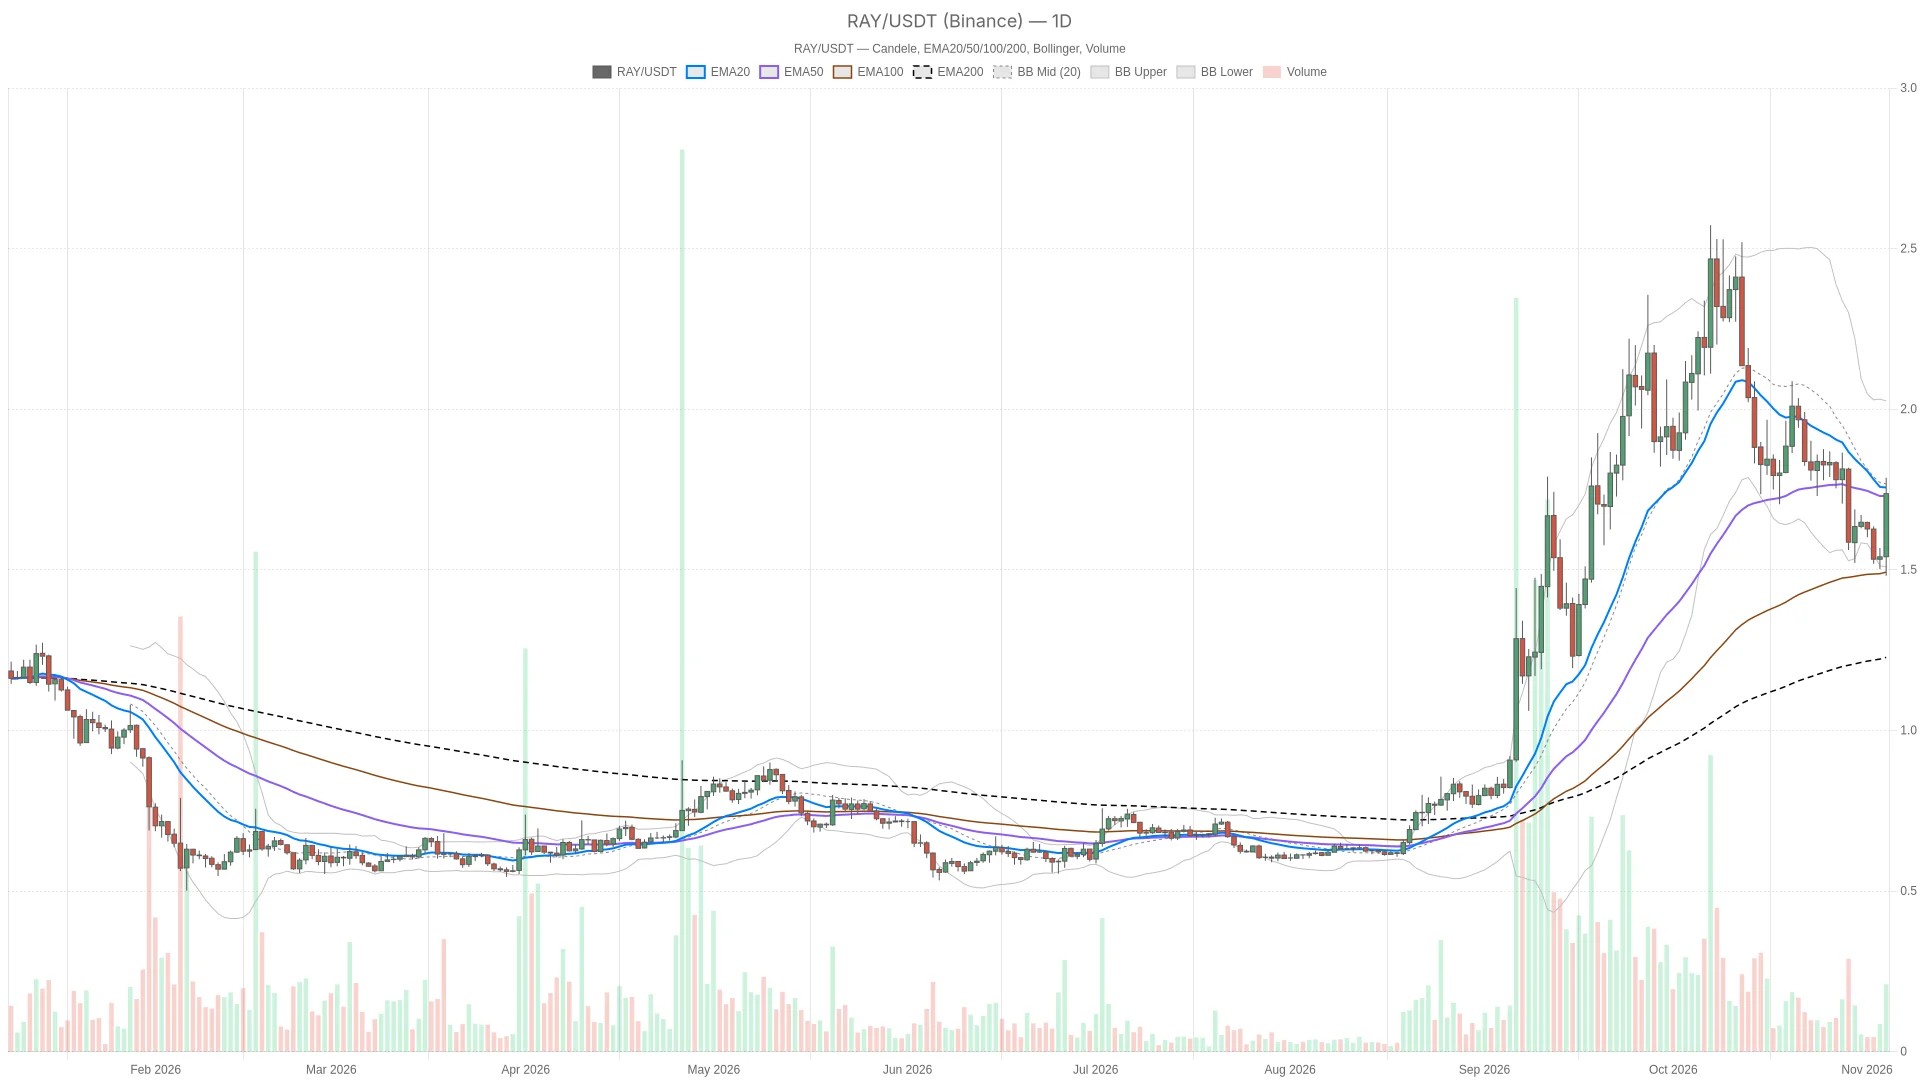
Raydium price recovery lacks daily confirmation
The recovery lacks daily confirmation from momentum indicators. The last completed daily candle closed at $1.54, while the live price is substantially higher. That distinction matters: the current daily candle is still open, so its recovery is not yet a completed daily signal. The daily RSI remains below its midpoint and the MACD histogram is negative, keeping the broader bias cautious despite the rebound.
The hourly chart offers stronger price positioning, with $RAY above all three tracked EMAs. The 15-minute structure is also bullish, but its momentum is weakening. These horizons disagree in a useful way: the daily chart has not confirmed a reversal, while the shorter charts show a recovery that is vulnerable to a pause. The 15-minute chart provides execution context, not grounds to override the daily bias.
Bullish daily EMA alignment meets nearby resistance
Daily EMA alignment is bullish, but price faces resistance at the EMA20. Binance-based daily averages are bullishly aligned, with the EMA20 at $1.76, the EMA50 at $1.73 and the EMA200 at $1.22. Live price is below the EMA20 but above the EMA50 and EMA200. The underlying alignment is constructive, yet price has not reclaimed the fastest daily average; this is a repair attempt within that structure rather than clean upside confirmation.
On the hourly chart, price stands above the EMA20 at $1.66, EMA50 at $1.61 and EMA200 at $1.65, although those averages are not aligned. By contrast, the 15-minute EMA20 at $1.73, EMA50 at $1.69 and EMA200 at $1.61 are bullishly stacked, with price above each. The strongest alignment is therefore at the shortest horizon, where it carries less weight for the daily outlook.
The daily Bollinger midpoint at $1.77 remains overhead, between the lower band at $1.51 and upper band at $2.03. A recovery toward the midpoint still fits a mean-reversion reading; the upper band is not an immediate breakout objective. The hourly upper band at $1.80 provides a nearer reference if resistance gives way.
Notably, ATR measures approximately $0.15 on the daily chart, $0.04 hourly and $0.02 on the 15-minute chart. These ranges put the closely spaced overhead barriers into perspective: a move through one level alone would offer limited evidence of a durable change.
RSI and MACD show a recovery losing short-term force
RSI remains weak daily and is falling intraday
Daily RSI is 35.8, weak but not oversold. Hourly RSI has fallen to 65.9 from an overbought reading of 77.0, while the 15-minute reading has declined to 53.4. The intraday retreat leaves less momentum behind the recovery, but neither current short-term reading establishes an oversold condition.
MACD momentum conflicts across horizons
The daily MACD histogram is negative and its recent direction is flat, offering no clear momentum confirmation for a reversal. The hourly histogram remains positive but is narrowing, so upside momentum is fading rather than turning negative. On the 15-minute chart, the negative histogram is widening. That combination makes a short-term interruption plausible even while price remains above the intraday averages.
Hourly pivot and S1 define the conditional breakout tests
The nearest daily support is the daily EMA50 at $1.73, with the daily EMA20 at $1.76 acting as resistance. $RAY already trades above daily R1 at $1.57, so that level is support, not a pending upside trigger. The daily pivot at $1.54 is a deeper reference rather than the immediate battleground.
Bullish scenario: an hourly close above the hourly pivot at $1.75 would confirm a local reclaim and bring hourly R1 at $1.76 into focus. The next objective would be the hourly upper Bollinger band at $1.80. An hourly close back below the hourly pivot would invalidate that local breakout. The likeliest false bullish signal is a brief push above the pivot that fails around the nearby daily EMA20, particularly with hourly momentum fading.
Bearish scenario: an hourly close below hourly S1 at $1.71 would confirm a local support failure. This would open a test of the hourly EMA20 at $1.66 and then the hourly EMA200 at $1.65. An hourly close back above hourly S1 would invalidate that breakdown. The likeliest false bearish signal is an intrahour breach that recovers before the candle completes.
Neither hourly trigger has been satisfied by the last completed hourly close at $1.73. For $RAY’s outlook, these are conditional tests within a neutral daily setup, not competing declarations of certainty. The ATR readings also make brief crossings credible noise; completed-candle acceptance is the distinction between a level being touched and a scenario being triggered.
Fear reading limits the case for broad risk appetite
Meanwhile, Alternative.me’s Fear & Greed Index stands at 34, classified as Fear. CoinGecko reports total cryptocurrency market capitalization of $2.70 trillion and Bitcoin dominance of 59.54%. The sentiment reading adds a defensive backdrop to $RAY’s recovery, while the market-cap and dominance snapshots alone do not establish any rotation toward or away from the asset.
FAQ
Is the daily setup bullish or bearish?
Neither is confirmed. The daily classification is neutral: bullish EMA alignment coexists with weak RSI and a negative MACD histogram.
Does bullish 15-minute structure confirm a daily reversal?
No. It describes short-term price positioning, while daily confirmation remains incomplete and 15-minute momentum is weakening.
{“@context”:”https://schema.org”,”@type”:”FAQPage”,”mainEntity”:[{“@type”:”Question”,”name”:”Is the daily setup bullish or bearish?”,”acceptedAnswer”:{“@type”:”Answer”,”text”:”Neither is confirmed. The daily classification is neutral: bullish EMA alignment coexists with weak RSI and a negative MACD histogram.”}},{“@type”:”Question”,”name”:”Does bullish 15-minute structure confirm a daily reversal?”,”acceptedAnswer”:{“@type”:”Answer”,”text”:”No. It describes short-term price positioning, while daily confirmation remains incomplete and 15-minute momentum is weakening.”}}]}
Disclaimer: This article is for informational purposes only and does not constitute financial advice, an investment recommendation, or a solicitation to buy or sell any financial instrument or cryptocurrency. The analysis provided is not indicative of future results. Investing in crypto assets and financial markets carries a high risk of capital loss. Always do your own research (DYOR) and consult a qualified financial advisor before making any decision.
Article produced with the assistance of artificial intelligence and reviewed by the editorial team.

 en.cryptonomist.ch