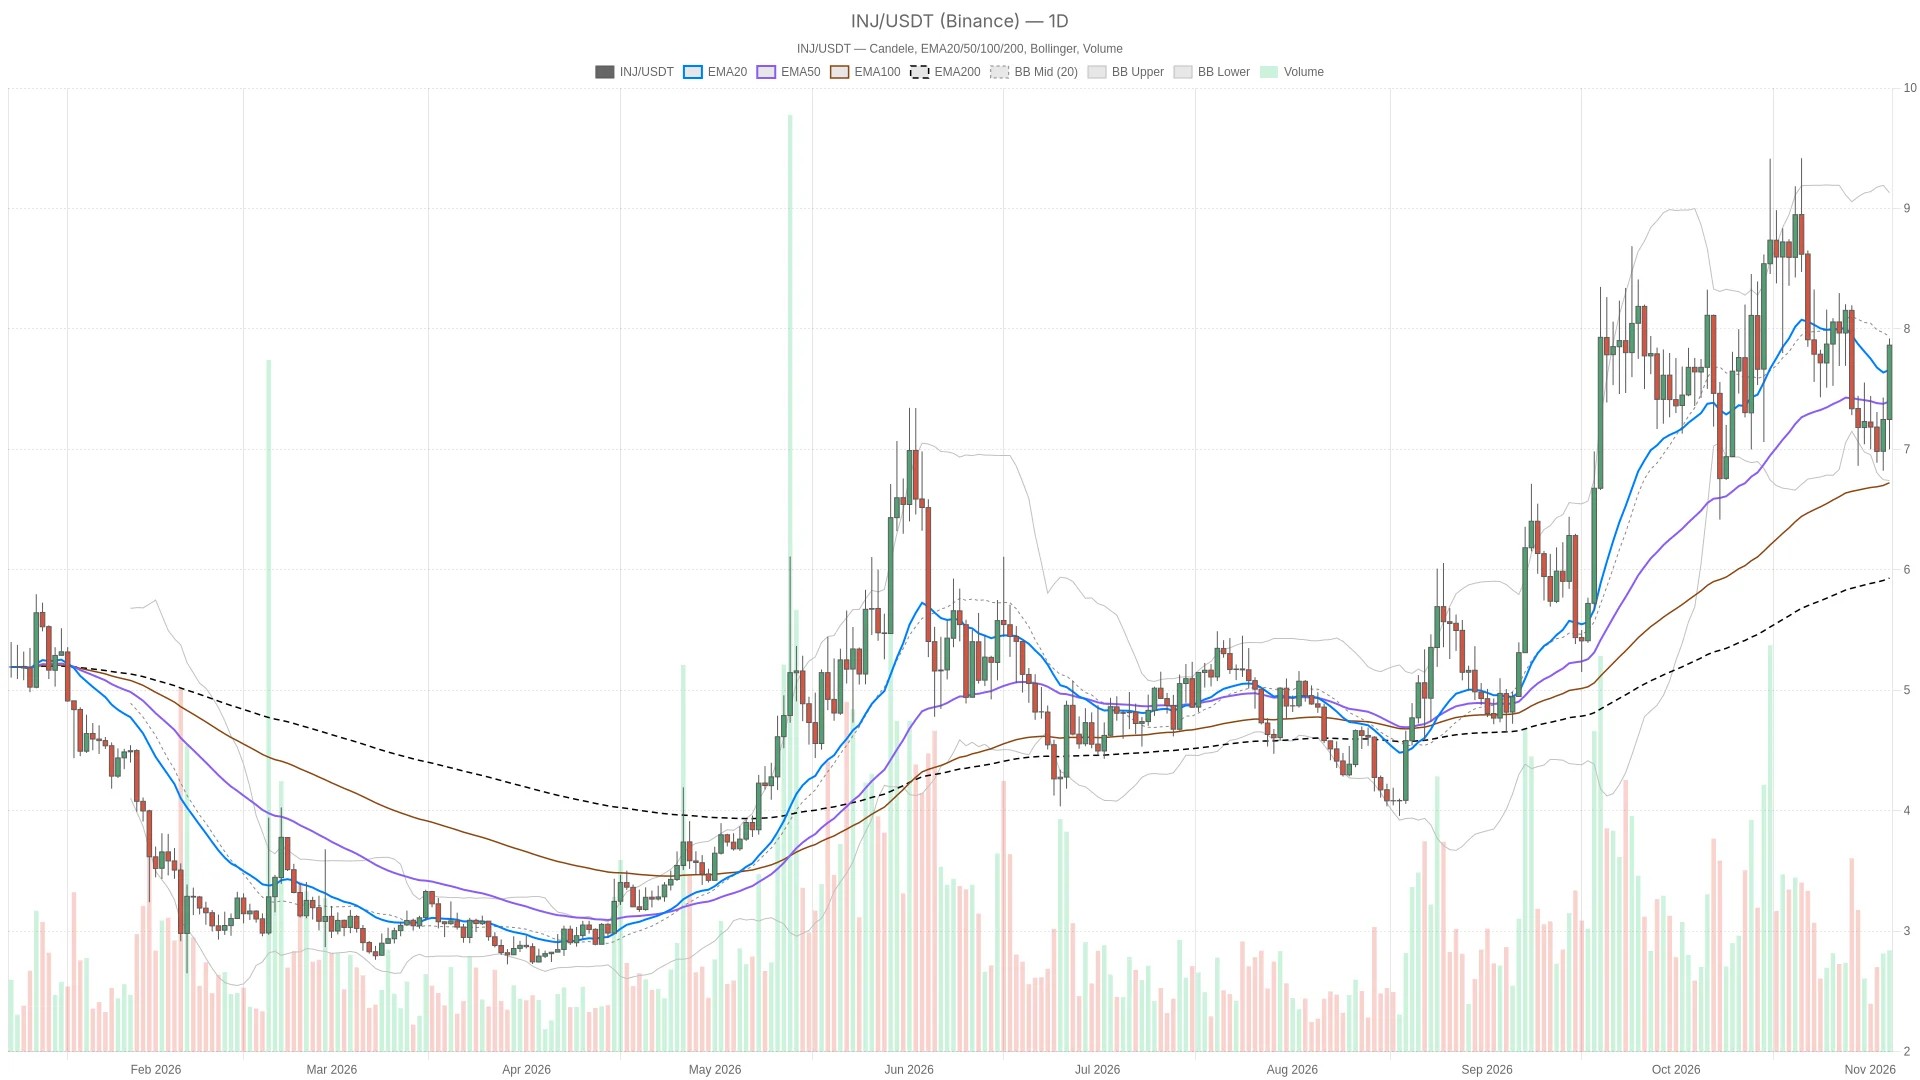
The immediate contest is between trend continuation and short-term mean reversion. Daily momentum has not fully recovered, and hourly momentum is losing strength despite an overbought reading. That makes acceptance above nearby resistance more important than the live price alone.
Fear and mixed DEX activity temper the bullish setup
CoinGecko puts total crypto market capitalization at $2.69 trillion and Bitcoin dominance at 59.55%. Alternative.me’s Fear & Greed Index reads 34, classified as Fear. This is a cautious sentiment backdrop rather than clear evidence of broad risk appetite; it does not establish what is driving $INJ.
Chain-wide DEX data records $814,241.60 in 24-hour DEX trading volume across the Injective blockchain. Venue activity is mixed: Choice Exchange V2 shows a daily increase of 187.68%, while TrueCurrent and Injective Spot show declines of 42.40% and 71.93%, respectively. These are chain-wide venue statistics, not $INJ-specific trading volume or token revenue, and they do not provide uniform confirmation of stronger activity.
Injective price holds bullish daily structure, but hourly averages are not aligned
Binance candle data place price above the daily EMA20 at $7.64, EMA50 at $7.38 and EMA200 at $5.91. Those averages are stacked in bullish order, supporting the positive daily bias. Still, the last completed daily candle closed at $7.25; the current price is a live reading, not a completed daily confirmation.
On the hourly chart, price is above the EMA20 at $7.61, EMA50 at $7.41 and EMA200 at $7.42. The averages are not aligned in bullish order. In practice, price strength is clearer than the underlying hourly trend structure, which weakens the case for a fully established continuation move.
Meanwhile, the 15-minute chart supplies execution context rather than the main directional call. Price is above its EMA20 at $7.81, EMA50 at $7.71 and EMA200 at $7.41, with bullish alignment. That supports the immediate advance, but cannot override the unresolved daily momentum picture.
Overbought hourly momentum conflicts with the daily recovery
Daily RSI is rising at 44.3, while the daily MACD histogram remains negative. The recovery therefore has some momentum support, but not enough to describe daily momentum as bullish outright. Price structure is ahead of confirmation.
Hourly RSI is overbought at 74.5, while the positive hourly MACD histogram is narrowing. That combination leaves the advance vulnerable to a pause even without a trend reversal. On the 15-minute chart, RSI is 56.8 and the MACD histogram has crossed below zero and is falling: the shortest timeframe is already showing weaker momentum beneath its bullish moving-average structure.
Moreover, the daily Bollinger midpoint at $7.97 remains overhead, with the upper and lower bands at $9.19 and $6.75. Price has not yet reclaimed the center of that daily range. The hourly upper band at $8.06 is another nearby reference, making the immediate upside test more demanding than the moving averages alone imply.
Daily ATR is $0.66, compared with $0.13 hourly and $0.07 on the 15-minute chart. These readings put the narrow distance to nearby resistance in perspective: an intraday breach can occur within ordinary price movement without establishing a durable breakout.
Hourly resistance at $7.90 separates continuation from a failed advance
The nearest resistance is hourly R1 at $7.90. Below price, the hourly pivot at $7.85 is immediate support, followed by hourly S1 at $7.78. The last completed hourly close was $7.84, below that pivot, so the live move back above it is not yet confirmed by a completed candle. The daily R1 at $7.51 is already below price and now serves as a support reference, not a pending upside trigger; the daily pivot lies farther down at $7.17.
Bullish scenario: an hourly close above $7.90
An hourly close above hourly R1 at $7.90 would strengthen the continuation case, bringing the daily Bollinger midpoint at $7.97 and hourly upper band at $8.06 into focus. An hourly close below the hourly pivot at $7.85 would invalidate that immediate breakout setup. The likeliest false signal is a brief push above resistance that fails to hold, given stretched hourly RSI and a narrowing positive histogram.
Bearish scenario: an hourly close below $7.78
An hourly close below hourly S1 at $7.78 would favor a deeper retracement toward the daily EMA20 at $7.64, followed by the hourly EMA20 at $7.61. An hourly close back above the hourly pivot at $7.85 would invalidate that immediate bearish setup. Such a retracement would challenge the advance without, by itself, overturning the bullish daily moving-average structure.
FAQ
Is the main $INJ bias bullish or bearish?
The daily bias is bullish on moving-average structure, but the negative daily MACD histogram leaves momentum confirmation incomplete.
Does overbought hourly RSI establish a reversal?
No. Here it flags short-term vulnerability; the bearish scenario still requires an hourly close below hourly S1 at $7.78.
What level must $INJ reclaim to confirm continuation?
An hourly close above hourly R1 at $7.90 would strengthen the continuation case and bring the daily Bollinger midpoint at $7.97 into focus.
{“@context”:”https://schema.org”,”@type”:”FAQPage”,”mainEntity”:[{“@type”:”Question”,”name”:”Is the main $INJ bias bullish or bearish?”,”acceptedAnswer”:{“@type”:”Answer”,”text”:”The daily bias is bullish on moving-average structure, but the negative daily MACD histogram leaves momentum confirmation incomplete.”}},{“@type”:”Question”,”name”:”Does overbought hourly RSI establish a reversal?”,”acceptedAnswer”:{“@type”:”Answer”,”text”:”No. Here it flags short-term vulnerability; the bearish scenario still requires an hourly close below hourly S1 at $7.78.”}},{“@type”:”Question”,”name”:”What level must $INJ reclaim to confirm continuation?”,”acceptedAnswer”:{“@type”:”Answer”,”text”:”An hourly close above hourly R1 at $7.90 would strengthen the continuation case and bring the daily Bollinger midpoint at $7.97 into focus.”}}]}
Disclaimer: This article is for informational purposes only and does not constitute financial advice, an investment recommendation, or a solicitation to buy or sell any financial instrument or cryptocurrency. The analysis provided is not indicative of future results. Investing in crypto assets and financial markets carries a high risk of capital loss. Always do your own research (DYOR) and consult a qualified financial advisor before making any decision.
Article produced with the assistance of artificial intelligence and reviewed by the editorial team.

 en.cryptonomist.ch