The immediate contest is between improving intraday structure and a daily chart that still lacks confirmation. That distinction matters: a short-term breakout could extend the rebound without resolving the larger technical weakness.
Pancakeswap price strength on the hourly chart challenges a neutral daily bias
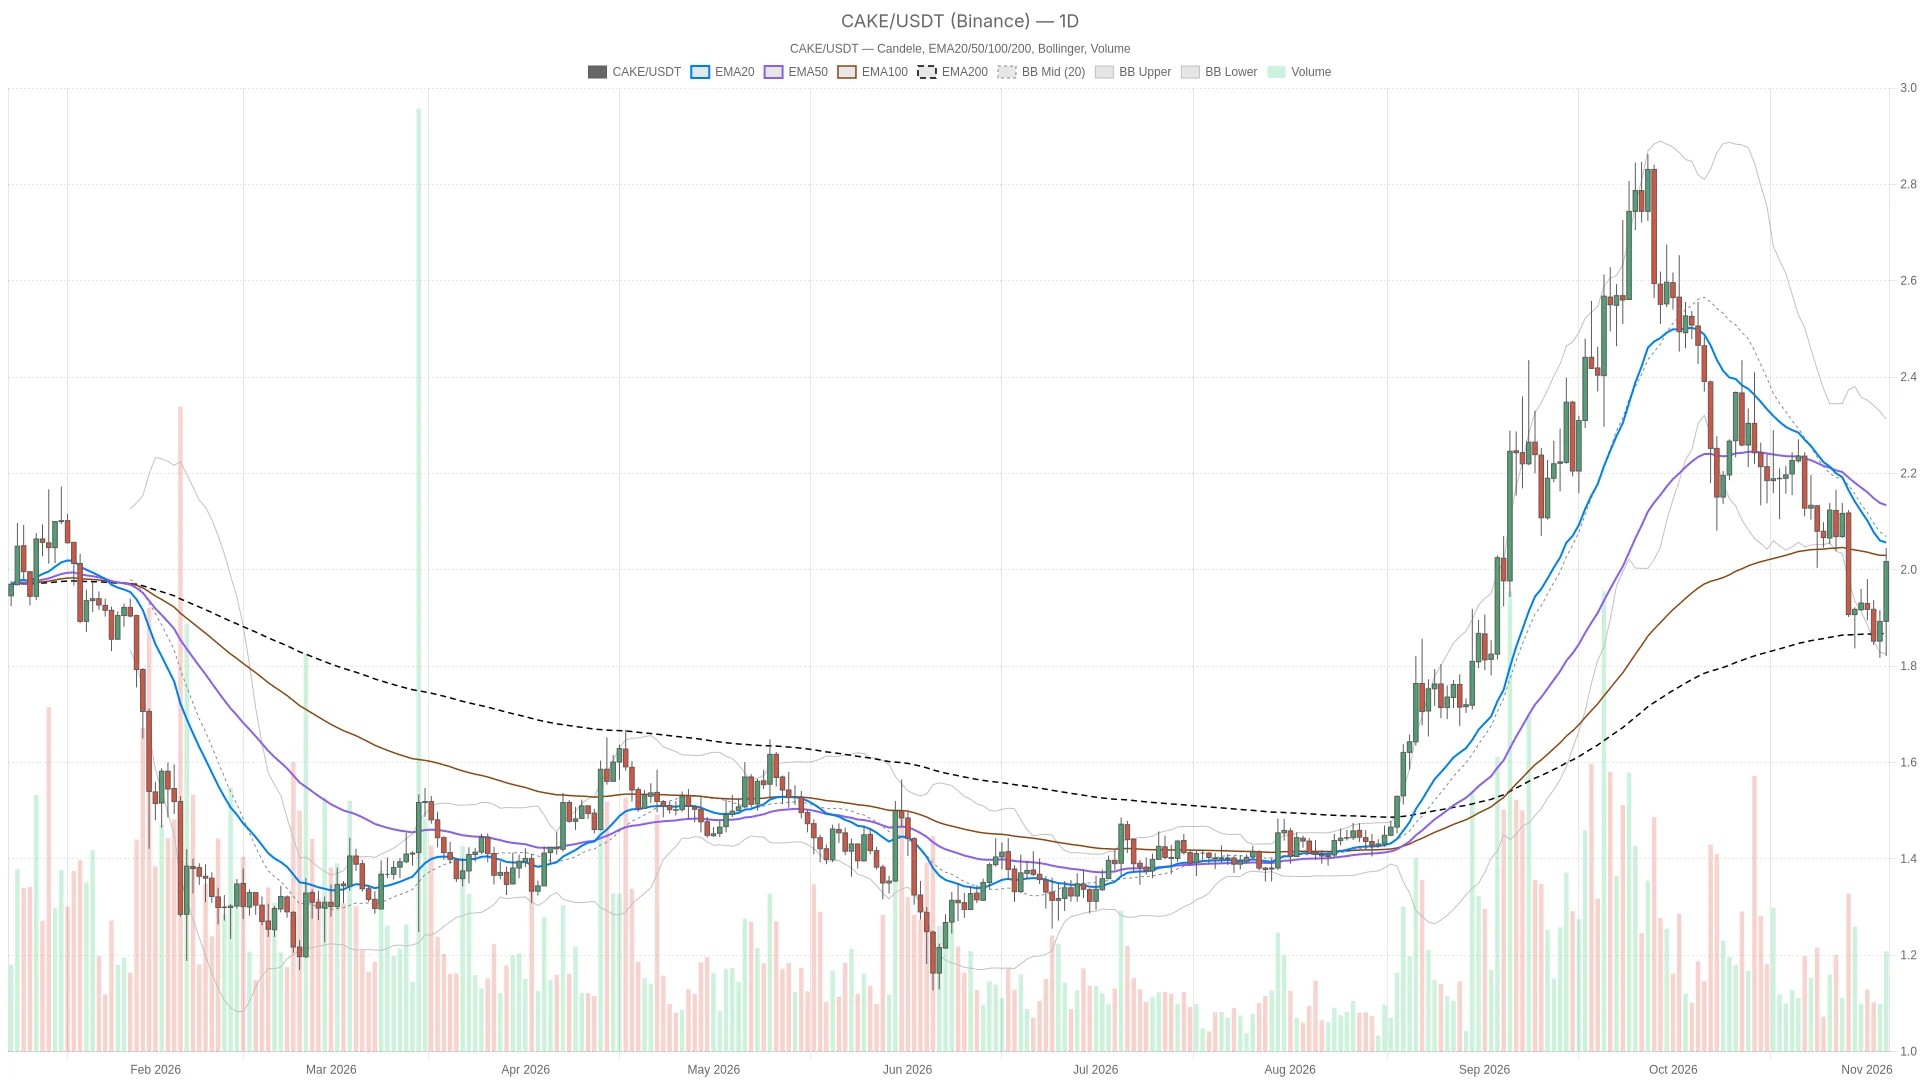
A completed daily recovery remains unconfirmed. Binance candle data show the live daily price above the last completed daily close of $1.89. That is a meaningful rebound, but the open candle cannot yet establish a completed daily recovery.
The hourly chart supports the rebound more convincingly than the daily chart, while the 15-minute chart provides execution context rather than a separate directional verdict. The central tension is straightforward: intraday strength is real, but treating it as an established daily uptrend would get ahead of the evidence.
Daily averages remain overhead despite a bullish 15-minute structure
$CAKE is below the daily EMA20 at $2.06 and EMA50 at $2.14, but above the daily EMA200 at $1.87. Those averages are not aligned. This leaves the daily structure caught between overhead recovery barriers and longer-term support, consistent with a neutral rather than outright bearish assessment.
On the hourly chart, price is above the EMA20 at $1.95, EMA50 at $1.91 and EMA200 at $1.95, although the averages themselves are not aligned. The 15-minute chart is stronger structurally: price is above its EMA20, EMA50 and EMA200, with a bullish ordering. In practice, the shortest horizon has the cleanest trend structure; the larger charts have not fully endorsed it.
The daily Bollinger midpoint at $2.08 sits above price, between outer bands at $1.83 and $2.33. That makes the rebound a move toward the center of the daily range, not an upper-band breakout. The hourly upper band at $2.05 adds another nearby obstacle before the daily recovery barriers.
Daily ATR is about $0.11. That volatility scale is substantial relative to the nearby hourly levels, so crossing an intraday threshold alone would offer limited evidence of a durable change in the daily trend.
RSI recovery conflicts with negative daily MACD
Momentum remains mixed rather than uniformly bullish. Daily RSI is rising at 34.1, showing an improvement from weak momentum without reaching a balanced reading. Hourly RSI is falling at 69.3, while 15-minute RSI is also falling at 58.2. The disagreement is important: daily momentum is recovering, but the shorter horizons are losing some of their immediate intensity. None of these current readings is oversold or overbought.
MACD reinforces the mixed picture. The daily histogram remains negative, while the hourly histogram is positive; neither has a confirmed directional trend in the supplied readings. On the 15-minute chart, the negative histogram is widening. That combination favors caution about immediate continuation: the hourly rebound still has momentum support, but its execution timeframe is weakening.
Hourly pivot separates continuation from a failed rebound
The nearest overhead threshold is the hourly pivot at $2.02, narrowly above the live quote before rounding. Hourly R1 at $2.04 and the hourly Bollinger upper band at $2.05 are the next resistance levels. Below price, hourly S1 at $2.00 is the closest support. These are distinct hourly references, not confirmation that the daily trend has changed.
Bullish scenario: an hourly close above the hourly pivot at $2.02 would activate a continuation case toward hourly R1 at $2.04 and the hourly upper band at $2.05. The daily EMA20 at $2.06 would then test whether the advance can extend beyond a short-term rebound. An hourly close below hourly S1 at $2.00 would invalidate this continuation setup.
Bearish scenario: an hourly close below hourly S1 at $2.00 would activate a failed-rebound case, exposing the hourly EMA200 at $1.95. The daily R1 at $1.93, already below price, is a deeper support reference, followed by the daily pivot at $1.88. An hourly close back above the hourly pivot at $2.02 would invalidate that breakdown case.
The likeliest false signal is a brief move above the hourly pivot that fails to hold, given the weakening 15-minute momentum and nearby overhead barriers. Conversely, a brief dip through hourly support would be less convincing than a completed hourly close below it. The $CAKE setup therefore depends on acceptance beyond these levels, not merely touching them.
Fear reading offers no broad risk-on confirmation
Alternative.me’s Fear & Greed Index stands at 34, classified as Fear. CoinGecko reports total cryptocurrency market capitalization of approximately $2.69 trillion and Bitcoin dominance of 59.55%. The sentiment reading provides a cautious backdrop; the capitalization and dominance snapshots alone do not establish a directional shift in market risk appetite.
FAQ
Is the quoted $CAKE price a completed daily close?
No. It is the live price of an open candle. The analysis distinguishes that quote from completed-candle readings.
Does a bullish 15-minute structure establish a daily reversal?
No. Here, it supplies execution context while the daily chart remains neutral and below its EMA20 and EMA50.
{“@context”:”https://schema.org”,”@type”:”FAQPage”,”mainEntity”:[{“@type”:”Question”,”name”:”Is the quoted $CAKE price a completed daily close?”,”acceptedAnswer”:{“@type”:”Answer”,”text”:”No. It is the live price of an open candle. The analysis distinguishes that quote from completed-candle readings.”}},{“@type”:”Question”,”name”:”Does a bullish 15-minute structure establish a daily reversal?”,”acceptedAnswer”:{“@type”:”Answer”,”text”:”No. Here, it supplies execution context while the daily chart remains neutral and below its EMA20 and EMA50.”}}]}
Disclaimer: This article is for informational purposes only and does not constitute financial advice, an investment recommendation, or a solicitation to buy or sell any financial instrument or cryptocurrency. The analysis provided is not indicative of future results. Investing in crypto assets and financial markets carries a high risk of capital loss. Always do your own research (DYOR) and consult a qualified financial advisor before making any decision.
Article produced with the assistance of artificial intelligence and reviewed by the editorial team.

 en.cryptonomist.ch