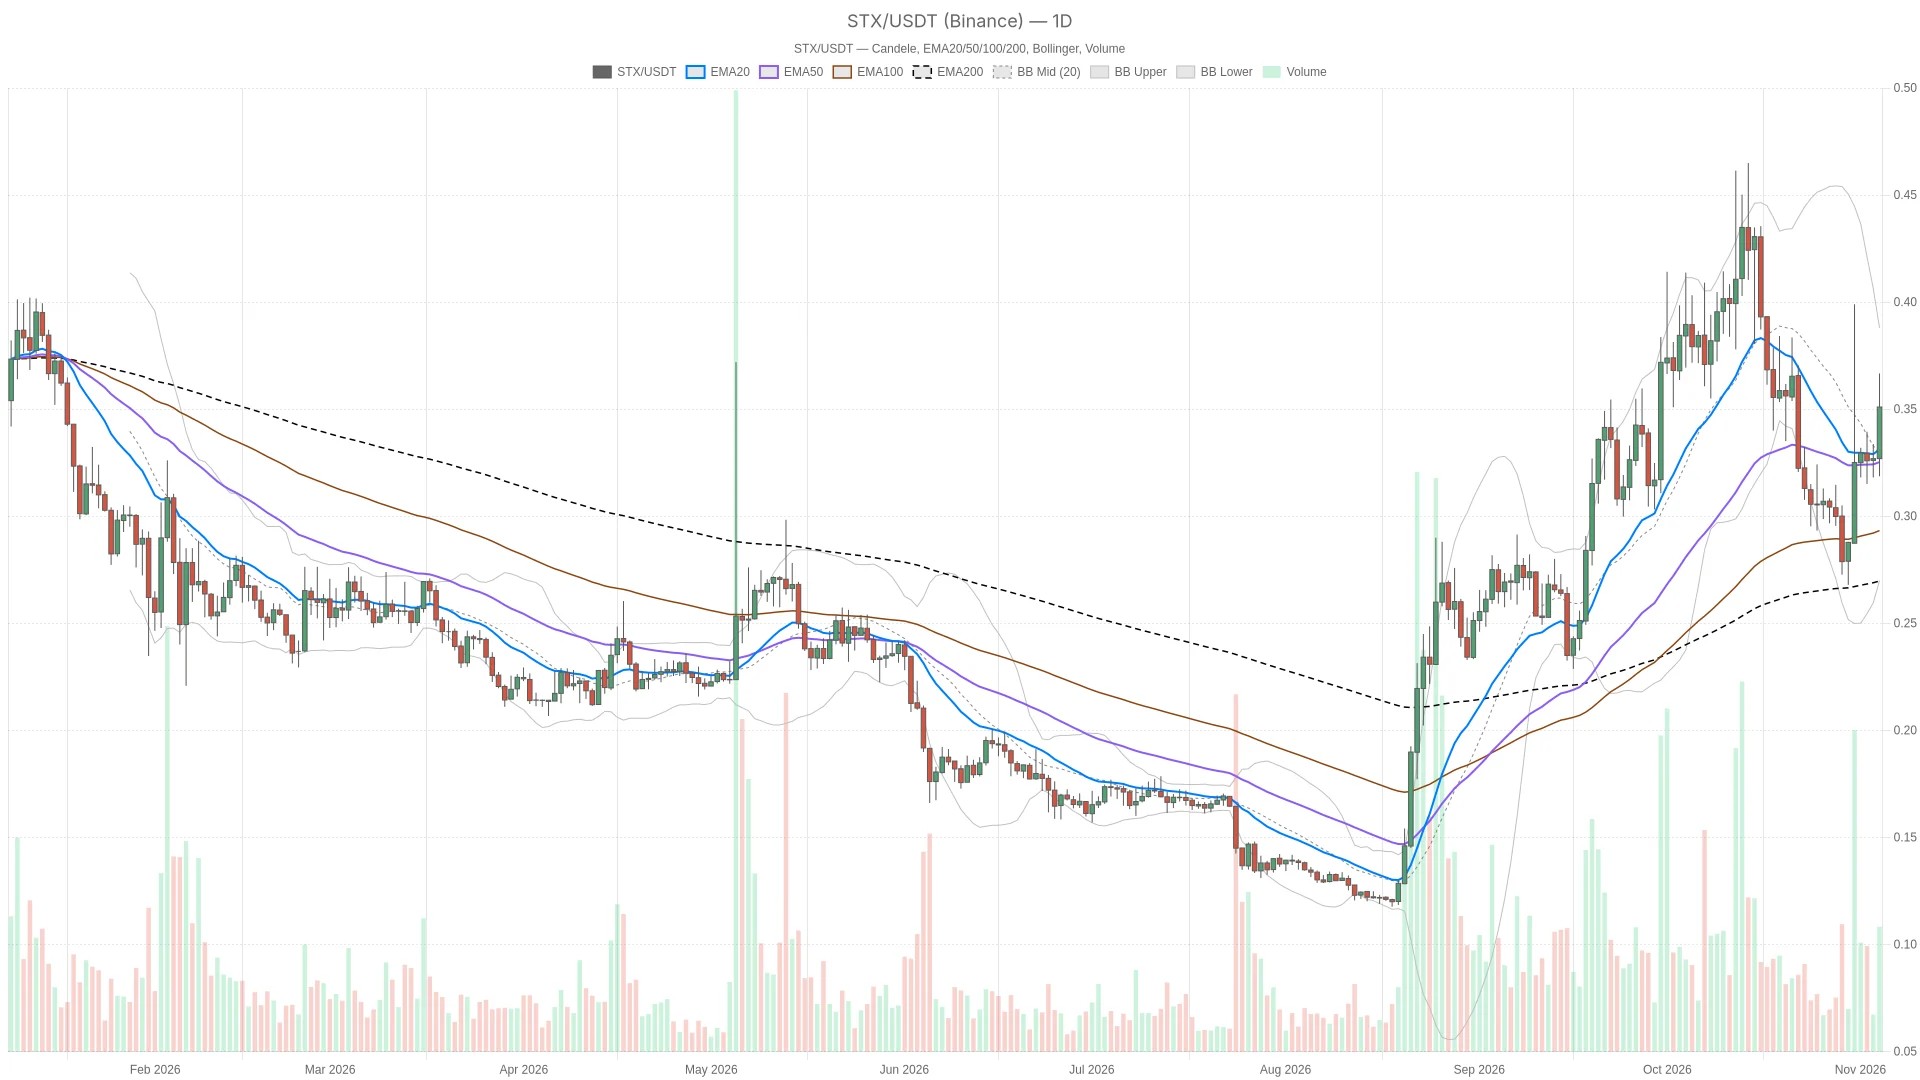
The distinction between live price and completed candles matters here. The last completed daily candle closed at $0.3269, below the daily R1 at $0.3344. The current move above that level is still unfolding, so treating it as an established daily breakout would be premature.
Mixed Stacks activity meets a fearful broader market
The broader crypto backdrop leans cautious rather than supportive. CoinGecko puts total crypto market capitalization at $2,693,950,284,262.14 and Bitcoin dominance at 59.55%. Alternative.me’s Fear & Greed Index reads 34, classified as Fear. That sentiment backdrop calls for caution about assuming broad risk appetite will reinforce $STX’s bullish structure; it does not, by itself, establish a bearish direction.
Meanwhile, decentralized exchanges on the Stacks blockchain recorded $663,797.00 in trading volume over the past 24 hours. Venue activity is mixed: Bitflow’s daily trading volume increased 4.99%, ALEX’s increased 641.16%, and Velar AMM’s declined 18.18%. These are chain-wide venue statistics, not $STX-specific trading volume or asset revenue. The uneven participation is not clean confirmation of a broad expansion in activity.
Stacks price structure stays bullish despite a short-term pause
The daily EMA structure is aligned bullishly, with the 20-day average at $0.3291 above the 50-day at $0.3242 and the 200-day at $0.2690. Live price is above each one. That keeps the main bias bullish: a short-term setback would not automatically overturn the broader trend structure.
Moreover, the hourly chart supports that reading. Price is above the hourly EMA20 at $0.3424, EMA50 at $0.3343 and EMA200 at $0.3192, with the averages also in bullish order. This gives the daily thesis intraday structural backing, rather than leaving it dependent on the unfinished daily candle alone.
By contrast, the execution picture is less convincing. On the 15-minute chart, price is below the EMA20 at $0.3516 but above the EMA50 at $0.3473 and EMA200 at $0.3352. Those averages remain bullishly ordered. In practice, the immediate move has lost traction without yet breaking the larger intraday structure—a pause within a bullish framework, not clear evidence of a reversal.
Momentum lags the structure, while volatility leaves room for whipsaws
Momentum has not yet confirmed the bullish structure. Daily RSI is 48.1, and the daily MACD histogram remains slightly negative, although its negative magnitude is narrowing. Downside momentum is easing, but daily momentum has not decisively endorsed the bullish EMA structure. This is the main weakness in the continuation case.
Meanwhile, hourly RSI stands at 57.7, while the positive hourly MACD histogram is narrowing and losing momentum. The hourly chart therefore supports the bullish bias structurally but weakens it on momentum. On the 15-minute chart, RSI is rising to 50.5 while the MACD histogram remains negative. That disagreement argues against mistaking an execution-timeframe bounce for a decisive change in the broader setup.
The daily Bollinger midpoint is $0.3330, with the upper band at $0.4063 and the lower band at $0.2596. Price above the midpoint supports the bullish reading, but the upper band is a distant reference rather than an immediate objective. On the hourly chart, the upper band at $0.3621 provides a much nearer boundary for the advance.
Daily ATR is $0.03270, compared with hourly ATR of $0.01003. Those ranges underline the risk of price moving through a nearby level without establishing acceptance beyond it. A brief breach is weaker evidence than a completed candle, particularly around the closely spaced intraday support levels.
The hourly pivot at $0.3545 separates continuation from a deeper retracement
Bullish scenario: An hourly close above the hourly pivot at $0.3545 would confirm a fresh continuation attempt. The last completed hourly candle at $0.3499 has not satisfied that trigger. The next resistance is hourly R1 at $0.3621; the daily Bollinger upper band at $0.4063 remains the broader upside reference. This scenario would be invalidated by an hourly close below the hourly EMA20 at $0.3424.
Bearish scenario: An hourly close below hourly S1 at $0.3423, just beneath the hourly EMA20, would favor a deeper retracement toward the hourly Bollinger midpoint at $0.3396 and then daily R1 at $0.3344. The bearish scenario would be invalidated by an hourly close back above the hourly pivot at $0.3545. This would initially be a countertrend move against the bullish daily structure, not confirmation of a daily downtrend.
The likeliest false signal is a brief push above the hourly pivot that fails before the candle closes. Conversely, a short-lived dip through the hourly support area would not meet the bearish trigger. With hourly momentum fading and daily momentum still unconfirmed, close-based confirmation carries more weight than the first touch of either boundary.
FAQ
Is $STX currently overbought?
No. Daily RSI is 48.1, hourly RSI is 57.7 and 15-minute RSI is 50.5; none is above 70.
Does Stacks DEX activity directly measure $STX demand?
No. The Stacks DEX volume figures describe trading volume across venues on the Stacks blockchain, not $STX-specific trading activity.
What would confirm the bullish continuation?
An hourly close above the hourly pivot at $0.3545 would confirm a fresh continuation attempt, with hourly R1 at $0.3621 as the next resistance.
{“@context”:”https://schema.org”,”@type”:”FAQPage”,”mainEntity”:[{“@type”:”Question”,”name”:”Is $STX currently overbought?”,”acceptedAnswer”:{“@type”:”Answer”,”text”:”No. Daily RSI is 48.1, hourly RSI is 57.7 and 15-minute RSI is 50.5; none is above 70.”}},{“@type”:”Question”,”name”:”Does Stacks DEX activity directly measure $STX demand?”,”acceptedAnswer”:{“@type”:”Answer”,”text”:”No. The Stacks DEX volume figures describe trading volume across venues on the Stacks blockchain, not $STX-specific trading activity.”}},{“@type”:”Question”,”name”:”What would confirm the bullish continuation?”,”acceptedAnswer”:{“@type”:”Answer”,”text”:”An hourly close above the hourly pivot at $0.3545 would confirm a fresh continuation attempt, with hourly R1 at $0.3621 as the next resistance.”}}]}
Disclaimer: This article is for informational purposes only and does not constitute financial advice, an investment recommendation, or a solicitation to buy or sell any financial instrument or cryptocurrency. The analysis provided is not indicative of future results. Investing in crypto assets and financial markets carries a high risk of capital loss. Always do your own research (DYOR) and consult a qualified financial advisor before making any decision.
Article produced with the assistance of artificial intelligence and reviewed by the editorial team.

 en.cryptonomist.ch