Crypto Price Analysis, ETH, XRP, XMR, LINK and PEPE, Nov. 4: Monero Clears Resistance as XRP Pulls Back and Chainlink Weakens
thecryptobasic.com
14 h
Monero clears resistance as $XRP retreats below $1.27 and Chainlink weakens. November 4 analysis covers $ETH, $XRP, $XMR, $LINK and $PEPE with key levels and charts.
Asset
Latest USD price
Past 24 hours
24-hour market volume
Market-cap rank
Ethereum ($ETH)
$2,244.05
−0.28%
$8.90 billion
2
$XRP
$1.26
+0.54%
$1.71 billion
5
Monero ($XMR)
$624.94
+2.53%
$169.81 million
12
Chainlink ($LINK)
$10.74
−3.38%
$267.04 million
17
Pepe ($PEPE)
$0.00000481
+2.40%
$380.92 million
45
Ethereum’s RSI Improves but the Recovery Remains Below $2,279.80
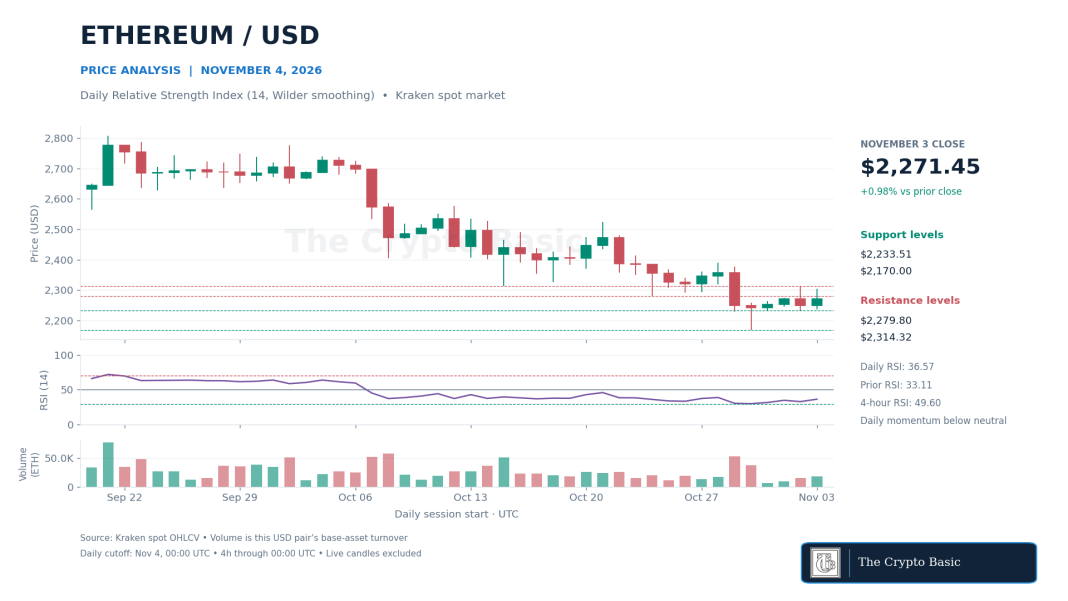
Ethereum closed Tuesday at $2,271.45, up 0.98%, after trading between $2,237.46 and $2,304.60. The entire session stayed within Monday’s range, so the gain did not establish a breakout above the preceding daily high.
Know when your coins move
Alerts, real-time prices, and market news — all in one app
Point your phone camera to install
4.8 based on 40K reviews in the App Store and Google Play
$ETH/USD daily RSI rises to 36.57, but Tuesday’s close remains below $2,279.80. Support lies near $2,233.51 and $2,170.
The latest $2,244.05 price was 2.70% below the price recorded in our November 2 analysis. That report identified $2,279.80 as an important recovery level. Tuesday traded above it but finished below it, leaving the reclaim unconfirmed on the daily chart.
The daily 14-period Relative Strength Index, calculated with Wilder smoothing, rose to 36.57 from 33.11. Selling momentum eased, but RSI remained below the neutral 50 level. The last completed four-hour reading was 49.60, also short of a clear bullish momentum signal.
A daily close back above $2,279.80 would improve the recovery. Clearing Monday’s $2,314.32 high and the nearby $2,319.54 resistance would provide stronger confirmation. Conversely, losing the $2,233.51–$2,237.46 support area would expose October 30’s $2,170 low. A daily close beneath $2,170 would invalidate the recovery from that low.
$XRP Breaks Above $1.27 Before Giving Back Part of the Advance
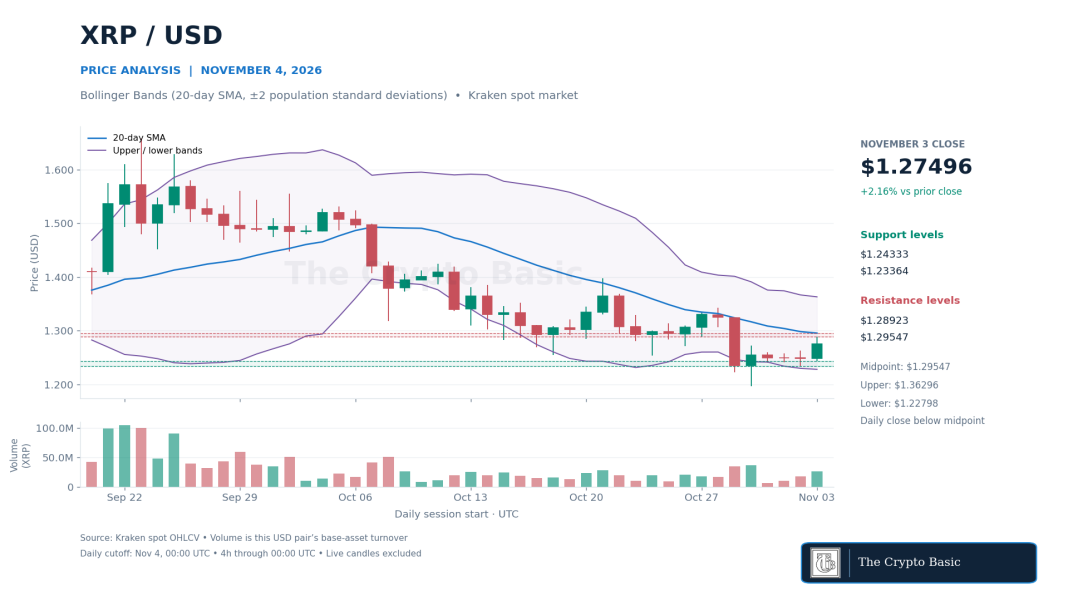
$XRP closed Tuesday at $1.27496, gaining 2.16%, after reaching $1.28923. That close cleared Monday’s $1.26254 high and October 30’s $1.27214 high, improving the daily structure. However, the latest $1.26 price had already slipped back beneath both levels during Wednesday’s unfinished session.
$XRP/USD closes above $1.27 but remains beneath its falling $1.29547 daily Bollinger midpoint; the latest price has retreated below the breakout area.
The move also followed the $1.23–$1.27 compression zone highlighted by The Crypto Basic. The four-hour candle ending November 3 at 16:00 UTC closed at $1.27871, above $1.27 and its upper Bollinger Band. The next two four-hour candles also closed above $1.27, confirming the initial short-term break before the latest retreat.
Daily Bollinger Bands, calculated from a 20-day simple moving average and two population standard deviations, show a less advanced recovery. Tuesday closed below the $1.29547 midpoint, which continued to fall. The lower and upper bands stood at $1.22798 and $1.36296.
A renewed hold above $1.27214 would restore the immediate breakout area. A daily close above $1.28923 would then put the midpoint near $1.29547 in focus. Failure to hold Tuesday’s $1.24333 low would weaken the recovery and expose $1.23364, followed by the lower band. A daily close below October 30’s $1.19685 low would invalidate the broader stabilization attempt.
Monero Confirms a Break Above the Prior Resistance Cluster
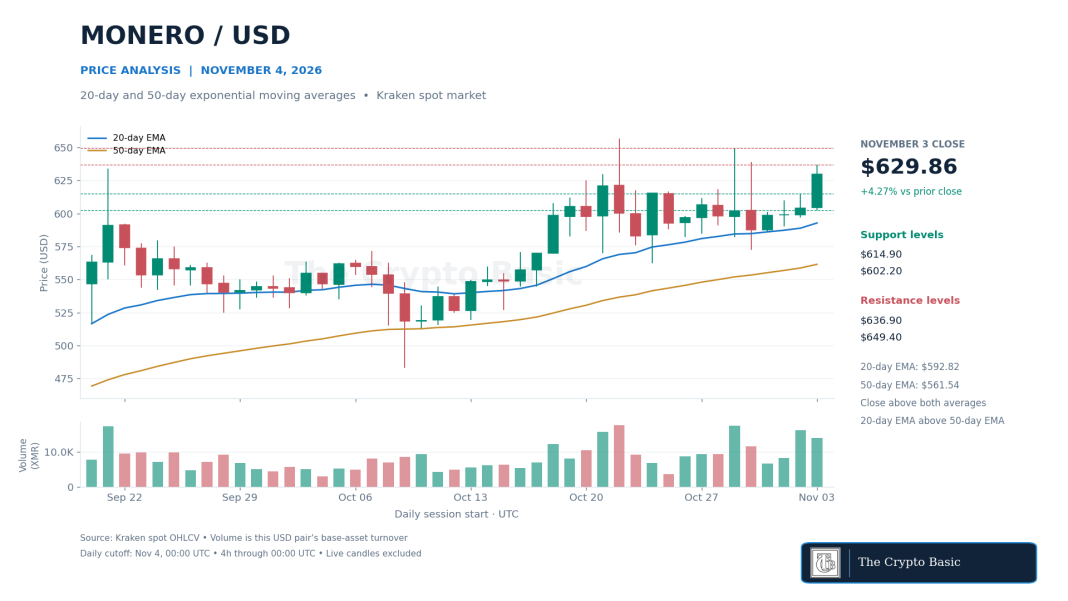
Monero closed Tuesday at $629.86, up 4.27%, after a $602.20–$636.90 session. The close cleared $609.88, $614.90 and $618.56, the successive recovery obstacles identified in Tuesday’s price analysis. Unlike Monday’s intraday advance, this move held above those levels at the daily close.
$XMR/USD closes at $629.86 above its prior resistance cluster and rising 20-day and 50-day EMAs, with $636.90–$638.87 the next resistance zone.
The daily moving averages support the improving structure. The 20-day exponential moving average rose to $592.82 from $588.92, while the 50-day EMA increased to $561.54 from $558.75. Price remained above both, with the faster average already above the slower one. This is an existing bullish alignment, rather than a newly confirmed crossover.
The latest $624.94 price had eased from Tuesday’s close but remained above the reclaimed resistance cluster. Holding that area would preserve the strongest part of the breakout.
A daily close above the $636.90–$638.87 resistance zone would strengthen the case for a test of $649.40, followed by the October 22 high at $656.74. A return below $614.90 would weaken the breakout, with Tuesday’s $602.20 low and Monday’s $596.76 low providing subsequent support. A daily close below October 30’s $572.49 low would invalidate the broader rebound.
Chainlink’s Bearish MACD Gap Widens as Price Slips Below $11
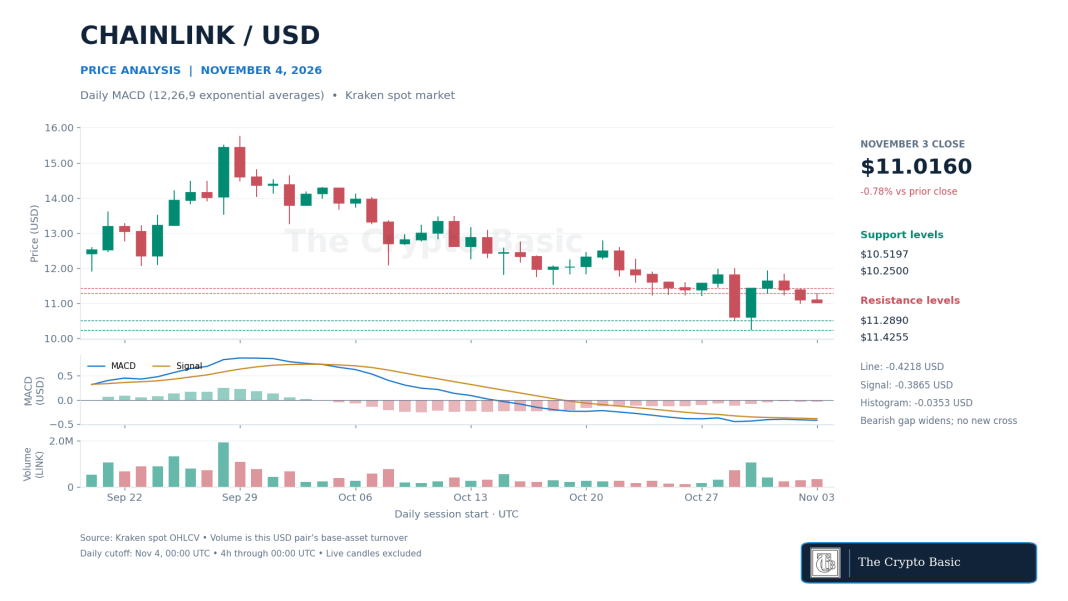
Chainlink closed Tuesday at $11.01603, down 0.78%, recording its third consecutive daily decline. The $11.28905 high was below Monday’s $11.42552 high, while the session low of $10.99545 remained just above Monday’s $10.97921 floor.
$LINK/USD’s daily MACD histogram widens below zero as Tuesday records a third consecutive decline. Structural support sits at $10.51969 and $10.25.
The latest $10.74 price was below both lows. That represents further weakness during the active session, but Wednesday has not yet confirmed a daily close beneath them.
Daily MACD, using 12- and 26-period exponential averages with a nine-period signal EMA, remained bearish. The line stood at −0.42178 against a −0.38648 signal. The histogram widened below zero to −0.03529 from −0.03302. This was deterioration within an existing bearish relationship, not a fresh line-signal crossover.
The latest completed four-hour candle also carried a negative histogram, at −0.02761, indicating that short-term momentum had not reversed by the technical cutoff.
Reclaiming $10.97921–$10.99545 would be the first repair. A daily close above $11.28905 would challenge the latest lower high, with $11.42552 the next confirmation level. Continued trading below the broken floor would leave October 29’s $10.51969 low exposed. Beneath that, October 30’s $10.25 low is the main support; a daily close below it would invalidate the rebound from that base.
$PEPE Rebounds but Daily Volume Remains Below Average
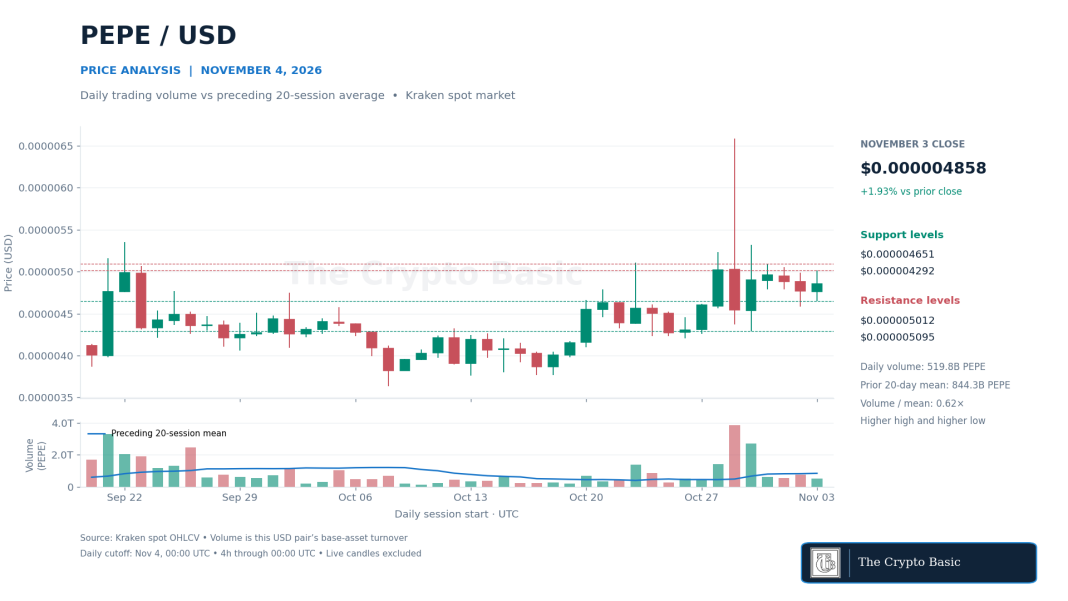
$PEPE closed Tuesday at $0.000004858, gaining 1.93%, after trading between $0.000004651 and $0.000005012. It formed a higher high and higher low than Monday, but finished below Monday’s $0.000004986 high. The intraday recovery therefore lacked a closing breakout above that earlier resistance.
$PEPE/USD gains 1.93% on daily turnover approximately 38% below its preceding 20-session average, leaving $0.000005012 as the first breakout test.
Trading participation was also relatively light. Turnover in the chart’s USD market reached 519.78 billion $PEPE, compared with a preceding 20-session average of 844.28 billion. Volume was approximately 38% below that average and 30% below Monday’s total. The price recovery is visible, but participation did not expand alongside it.
The latest $0.00000481 price remained below Tuesday’s close despite a 2.40% gain over the past 24 hours. Those figures cover different periods.
A daily close above $0.000005012 would clear Tuesday’s high, bringing $0.000005055–$0.000005095 into view. A stronger recovery would need to overcome that zone before challenging October 30’s $0.000005317 high. Losing $0.000004651 would weaken the higher-low formation, with $0.000004586 next. A daily close below October 30’s $0.000004292 low would invalidate the broader rebound.

 thecryptobasic.com