If There Was Ever a Time to Pay Attention to XRP, It’s Right Now: Analyst
thecryptobasic.com
16 h
$XRP analyst Casi Trades is urging traders to watch the asset closely, warning that its recent price consolidation below a key Fibonacci level could precede another sharp decline.
In a post on X, Casi highlighted $XRP’s continued struggle to reclaim the $1.26 Fibonacci level, which previously acted as support before breaking down.
She noted that the coin has spent several days consolidating beneath this level, a development she believes may set the stage for a fast downward move.
Know when your coins move
Alerts, real-time prices, and market news — all in one app
Point your phone camera to install
4.8 based on 40K reviews in the App Store and Google Play
“If there was ever a time to pay attention, it’s right now,” the analyst wrote, emphasizing that traders should not overlook $XRP’s current price behavior.
According to her analysis, the consolidation beneath the broken Fibonacci level is a warning sign. She suggested $XRP could drop further if buyers fail to reclaim the lost level.
Casi Identifies $1.10 and $0.90 as Key $XRP Targets
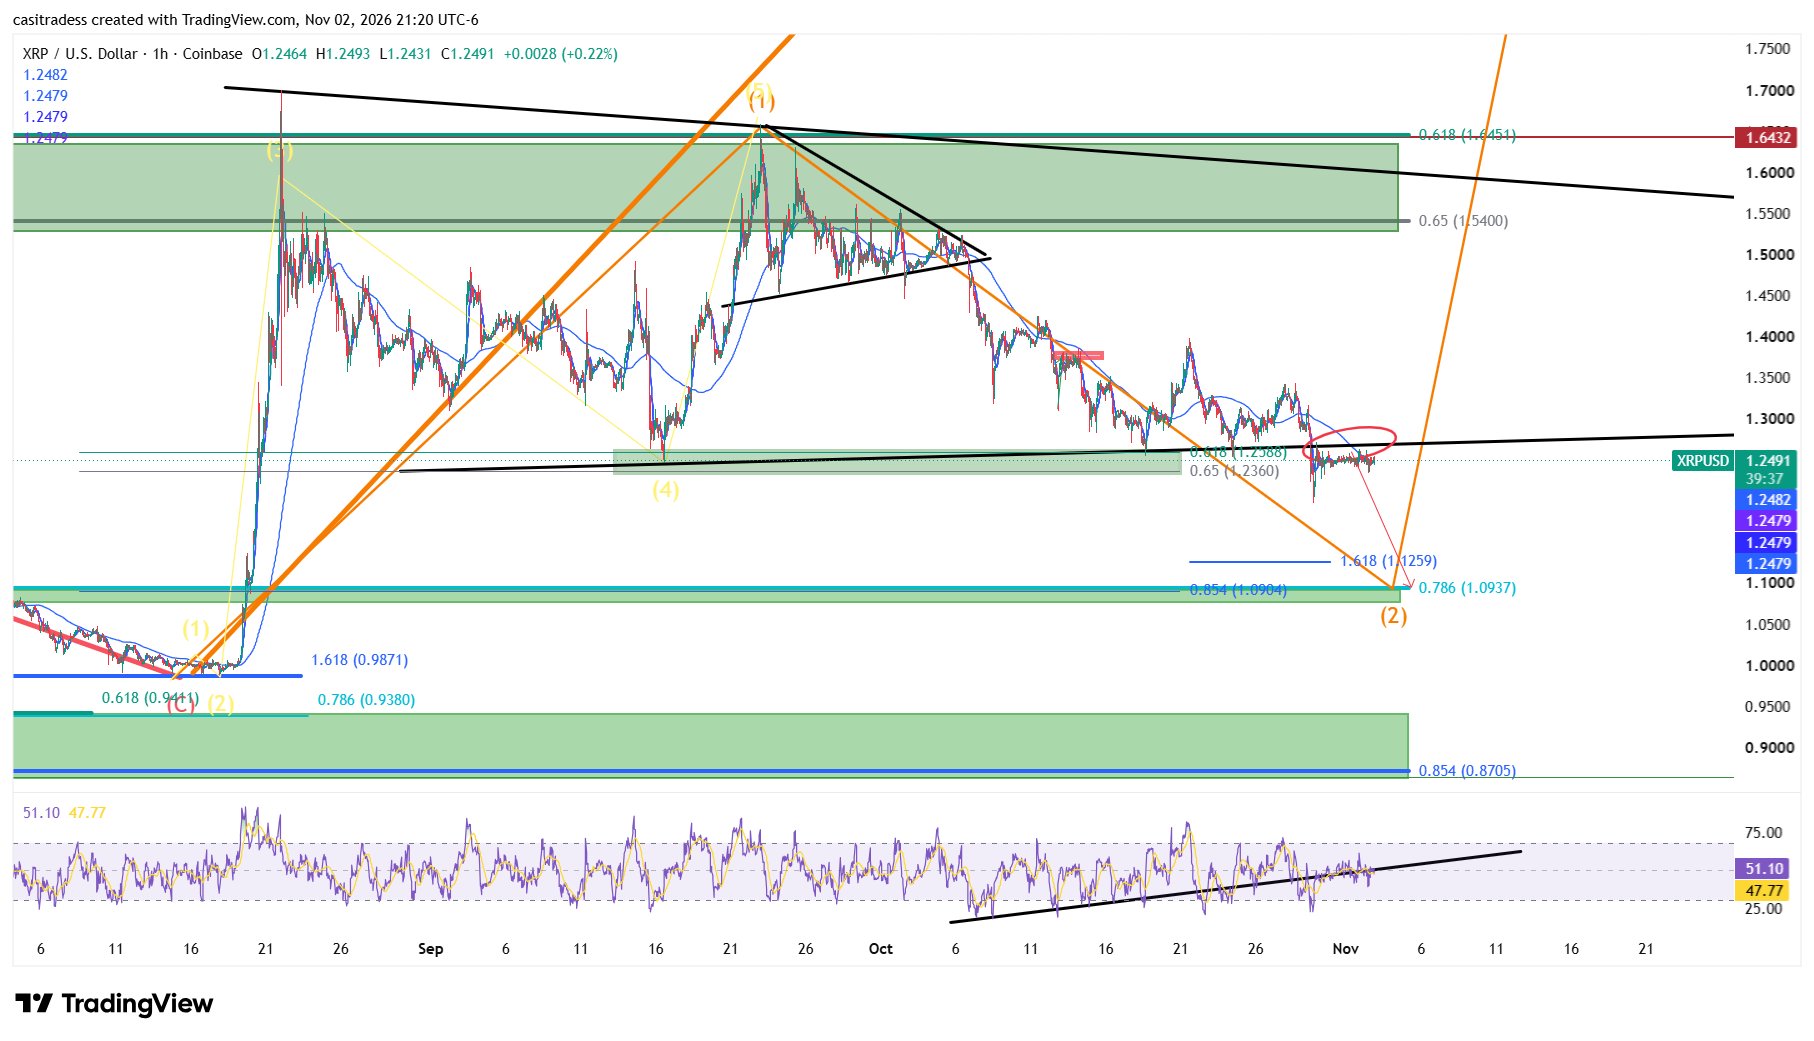
The analyst’s accompanying TradingView chart outlines a bearish scenario in which $XRP falls toward the $1.10 region before extending its decline to $0.90.
The chart identifies $1.10 as an important Fibonacci retracement area, with the 0.786 level sitting near $1.0937. Another Fibonacci extension targets around $1.1259.
Below that zone, Casi identifies $0.90 as another downside area to watch. Her chart places the 0.854 Fibonacci level near $0.8705, suggesting that $XRP could test the lower $0.90 region if selling pressure continues.
Meanwhile, the analyst warned that the anticipated move may happen quickly, leaving traders with little time to react once the market begins moving.
“This is exactly what we’ve been preparing for,” she added, explaining that she and her followers had spent months studying $XRP’s price action and identifying targets. She also pointed to the importance of watching momentum indicators as $XRP approaches the lower Fibonacci levels.
$XRP 1Hr Chart by Casi Trades Showing KeyFibonacci Levels
$XRP Struggles as Weekly Losses Deepen
$XRP’s recent performance provides context for the analyst’s warning. According to CoinMarketCap data, the cryptocurrency is trading around $1.24, down 4% over the past seven days and 17% over the past month.
The accompanying chart shows $XRP trading below $1.26, with several recent attempts to move higher failing to produce a sustained recovery.
The Relative Strength Index (RSI) indicator at the bottom of the chart stood near 51. This suggests momentum was relatively neutral at the time of the snapshot rather than extremely oversold.
Recovery to $1.7 Possible
However, Casi’s analysis does not rule out a temporary recovery. Her chart also sketches a larger upward move after the projected decline toward the lower Fibonacci targets. In particular, it projects a strong rebound to above $1.75.
In a follow-up comment, she asked followers to guess what happens after Wave 2 (W2), hinting at a possible subsequent upward wave under her Elliott Wave interpretation.
At the moment, the immediate levels are $1.26, $1.10, and $0.90. Whether $XRP reclaims the broken Fibonacci level or extends its decline to the analyst’s lower targets will determine which scenario takes shape.

 thecryptobasic.com