XRP Price Compression Puts a Possible 71% Rally Scenario in Focus
thecryptobasic.com
3 h
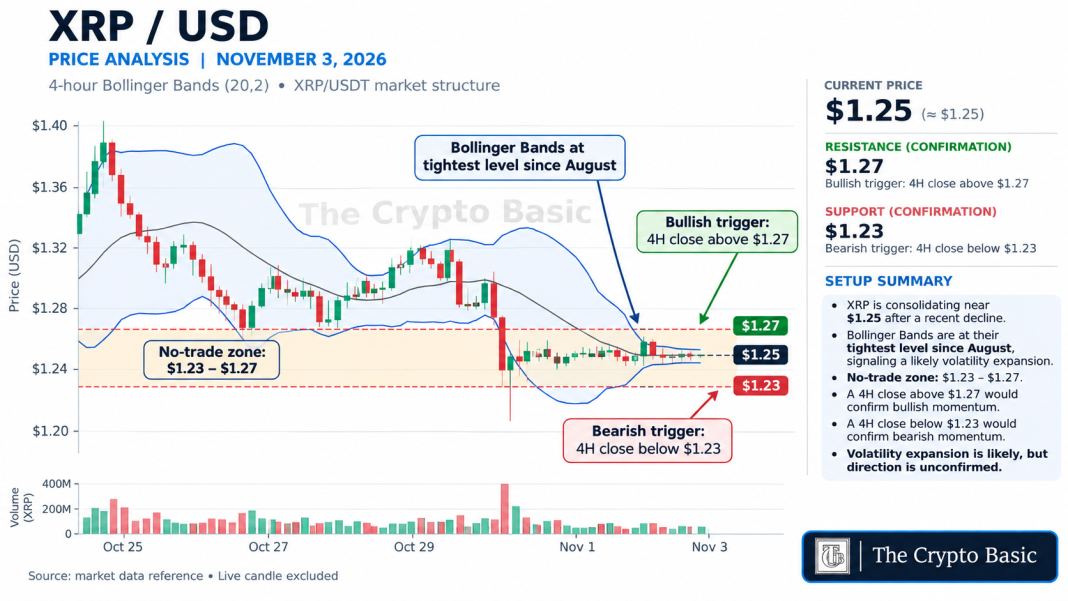
$XRP has entered one of its tightest volatility setups in months, with the Bollinger Bands on the four-hour chart compressing to their narrowest level since August.
The cryptocurrency is trading around $1.25, almost exactly in the middle of a narrow $1.23-$1.27 decision zone. The compression follows a sharp late-October decline that pushed $XRP from above $1.30 toward the current consolidation area.
The setup points to expanding volatility ahead, but the Bollinger Bands themselves do not determine whether the eventual break will be higher or lower.
Know when your coins move
Alerts, real-time prices, and market news — all in one app
Point your phone camera to install
4.8 based on 40K reviews in the App Store and Google Play
$XRP Volatility Collapses Around $1.25
The four-hour structure shows $XRP stabilizing after the latest selloff.
$XRP’s four-hour Bollinger Bands have compressed around $1.25, with $1.27 marking bullish confirmation and $1.23 defining the bearish breakout level.
Price previously traded above $1.35 and briefly approached the $1.40 area before a sequence of bearish candles accelerated the decline. The most aggressive part of the move pushed $XRP toward the lower $1.20s.
Since then, price action has changed considerably.
Instead of continuing lower, $XRP has spent several sessions moving sideways close to $1.25. The candles have become increasingly small while the upper and lower Bollinger Bands have contracted sharply around price.
This type of compression reflects a decline in recent volatility. When the bands become unusually narrow, a sufficiently strong move can force them to begin expanding again.
The current structure follows previous weakness that also brought $XRP back toward its important $1.25 support region.
Similar $XRP Squeeze Previously Preceded a 71% Rally
The last time $XRP’s four-hour Bollinger Bands became this compressed, in August, price subsequently rallied approximately 71% within three days.
That historical move helps explain why the latest squeeze deserves attention, but it does not establish another 71% rally as a forecast.
Bollinger squeezes measure contraction in volatility rather than direction. A breakout can expand aggressively in either direction once the market leaves the compressed range.
That makes the nearby price boundaries more important than the size of the previous rally.
$1.27 Is the Bullish Confirmation Level
The first upside trigger is $1.27.
With $XRP around $1.25, reaching $1.27 would require a gain of only about 1.6%. More importantly, the setup calls for a completed four-hour close above $1.27, rather than an intraday wick through the level.
Such a close would push $XRP above the upper edge of the current consolidation and provide initial confirmation that volatility is expanding upward.
Above $1.27, the next meaningful area is around $1.30-$1.34, where $XRP previously traded before the latest breakdown. The Crypto Basic has also highlighted the need for $XRP to reclaim the $1.30 region before the short-term structure materially improves.
A $1.23 Break Would Favor the Bears
The opposite boundary sits at $1.23, also about 1.6% below a $1.25 starting price.
A completed four-hour close below $1.23 would break $XRP beneath the consolidation floor and signal that the volatility expansion is developing to the downside.
That would return attention to the broader support structure around $1.20, followed by the lower levels previously identified beneath the market. Earlier analysis placed $1.26 and $1.10 among $XRP’s important downside levels.
Until either trigger is confirmed, the technical structure remains unresolved.
The next observable test is therefore simple: a four-hour close above $1.27 would favor an upside breakout, while a close below $1.23 would confirm renewed bearish pressure. Between those levels, $XRP remains trapped inside its volatility squeeze.

 thecryptobasic.com