The distinction matters here. A rebound from support would fit a mean-reversion move within the downtrend; it would not, by itself, establish a reversal. The immediate question is whether hourly price structure can catch up with the improvement in momentum.
Nexo price scenarios hinge on the hourly pivot and EMA20
Daily S1 at $0.7620 is the current support test. Just beneath it, the hourly pivot at $0.7617 separates a tentative hold from renewed downside exposure. Above price, the nearest resistance is the hourly EMA20 at $0.7655, followed by hourly R1 at $0.7663. These are the immediate checkpoints, rather than distant recovery targets.
Bullish scenario: An hourly close above the hourly EMA20 at $0.7655 would trigger a short-term recovery case, opening a test of hourly R1 at $0.7663. Further progress would bring the daily pivot at $0.7690 into view, with daily R1 at $0.7780 beyond it. An hourly close below the hourly pivot at $0.7617 would invalidate that recovery case. This is a rebound scenario, not a declaration that the daily downtrend has ended.
Bearish scenario: An hourly close below the hourly pivot at $0.7617 would trigger a continuation case toward hourly S1 at $0.7583. Beyond that, the hourly Bollinger lower band sits at $0.7573. An hourly close above the hourly EMA20 at $0.7655 would invalidate that immediate downside setup. The last completed hourly candle closed at $0.7630, so neither trigger has been satisfied.
In practice, the likeliest false signal is a brief push through nearby resistance that fails to hold on a completed hourly candle. These levels sit close together relative to hourly ATR of $0.006752, making an intrabar break less persuasive than sustained acceptance. Equally, a dip under support that promptly reverses would weaken the breakdown case.
RSI recovery conflicts with bearish daily MACD
The RSI rebound is genuine, but it has not shifted the bias away from a negative daily MACD. Daily RSI is rising at 32.3, approaching oversold territory without being oversold. Hourly RSI is also rising, at 44.7, while the 15-minute reading is 50.1 with mixed recent direction. The improvement is real in the completed-candle readings, but it is stronger as evidence of easing downside momentum than of durable upside control.
By contrast, MACD supplies the counterweight. The daily histogram remains negative with widening magnitude, keeping the broader momentum evidence bearish. On the hourly chart, the negative histogram is narrowing: downside momentum is losing force, but has not turned positive. The 15-minute histogram is positive with a flat recent trend, which supports a tactical bounce without confirming broader follow-through.
For $NEXO, however, this is a disagreement between momentum and structure rather than a clean bullish turn. The daily chart sets the bias, the hourly chart weakens the case for an immediate uninterrupted decline, and the 15-minute chart serves only as execution context.
Bearish EMA alignment outweighs the stretch below daily bands
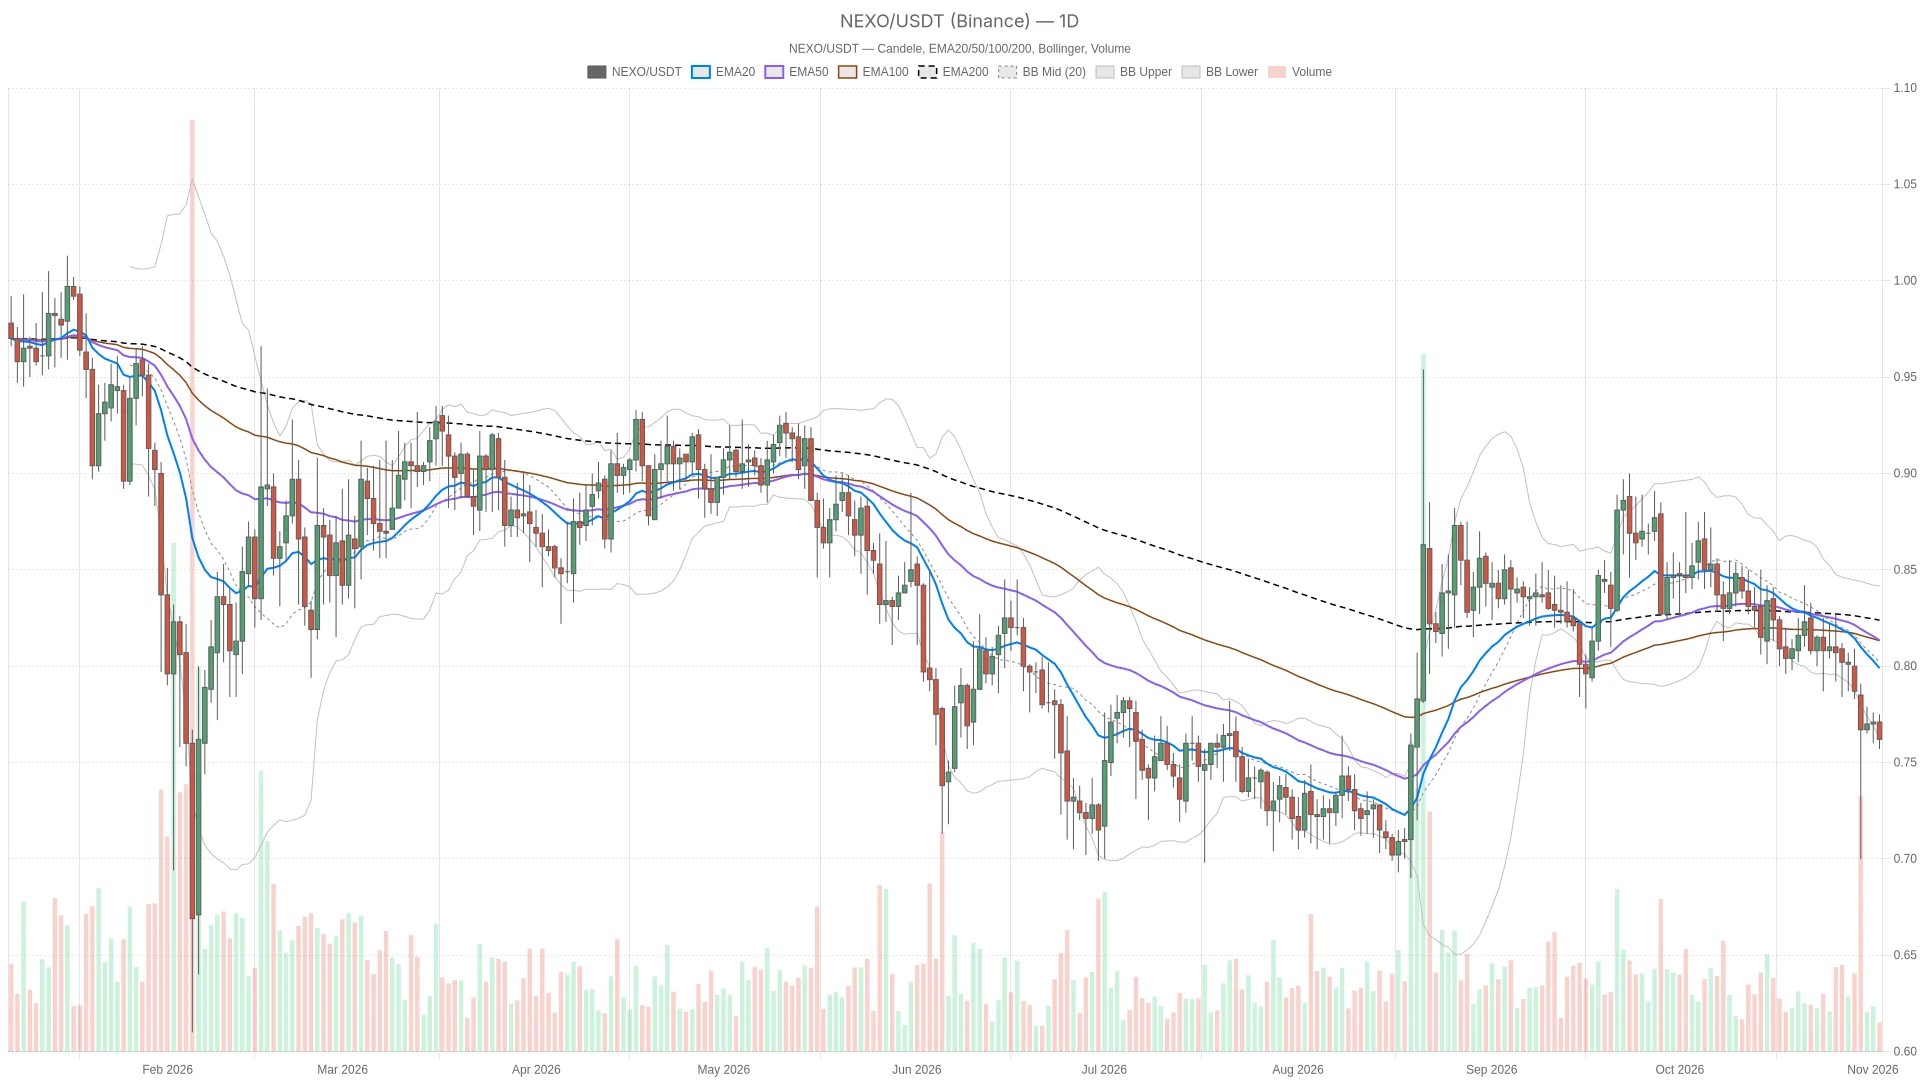
No timeframe shows a bullish EMA stack, so the stretch below the daily Bollinger bands does not offset the bearish alignment. Price remains below the daily EMA20 at $0.8028, EMA50 at $0.8155 and EMA200 at $0.8245. Their bearish alignment reinforces the daily downtrend. A support bounce would still leave substantial structural repair unfinished.
The hourly averages confirm that bias: price is below the EMA20 at $0.7655, EMA50 at $0.7686 and EMA200 at $0.7837, with bearish alignment. On the 15-minute chart, price is at the EMA20, below the EMA50 and below the EMA200; those averages are also bearishly aligned. Even the shortest timeframe has not established bullish trend structure.
The daily Bollinger lower band is at $0.7690, above the live price, while the midpoint is $0.8055 and the upper band is $0.8420. Trading beneath the lower band shows downside extension, but extension is not a reversal signal. The lower band and the separately calculated daily pivot both round to $0.7690. That area is therefore relevant to any attempt to move back inside the daily envelope.
Daily ATR is $0.02975, compared with $0.004511 on the 15-minute chart. Alongside the hourly volatility reading, these figures underline why a small intraday recovery can coexist with a bearish daily structure: movement alone is not evidence that the trend has changed.
Fear reading frames a defensive market backdrop
Market sentiment is cautious, with the Fear & Greed Index at 37, classified as Fear. CoinGecko puts total crypto market capitalization at $2.60 trillion, down 2.78% over 24 hours, with Bitcoin dominance at 59.95%. This is a defensive backdrop for evaluating a rebound, not proof of what caused $NEXO’s move.
FAQ
Is $NEXO’s daily RSI oversold?
No. It is approaching oversold territory, while its rising direction offers an early counterpoint to the bearish daily structure.
Does positive 15-minute MACD confirm a reversal?
No. The hourly histogram remains negative and the daily EMA structure remains bearish, so the positive short-term reading supports only a tentative rebound case.
What would invalidate the bearish continuation scenario?
A completed hourly candle above the hourly EMA20 would invalidate the immediate downside setup, although it would not end the daily downtrend.
Disclaimer: This article is for informational purposes only and does not constitute financial advice, an investment recommendation, or a solicitation to buy or sell any financial instrument or cryptocurrency. The analysis provided is not indicative of future results. Investing in crypto assets and financial markets carries a high risk of capital loss. Always do your own research (DYOR) and consult a qualified financial advisor before making any decision.
Article produced with the assistance of artificial intelligence and reviewed by the editorial team.

 en.cryptonomist.ch