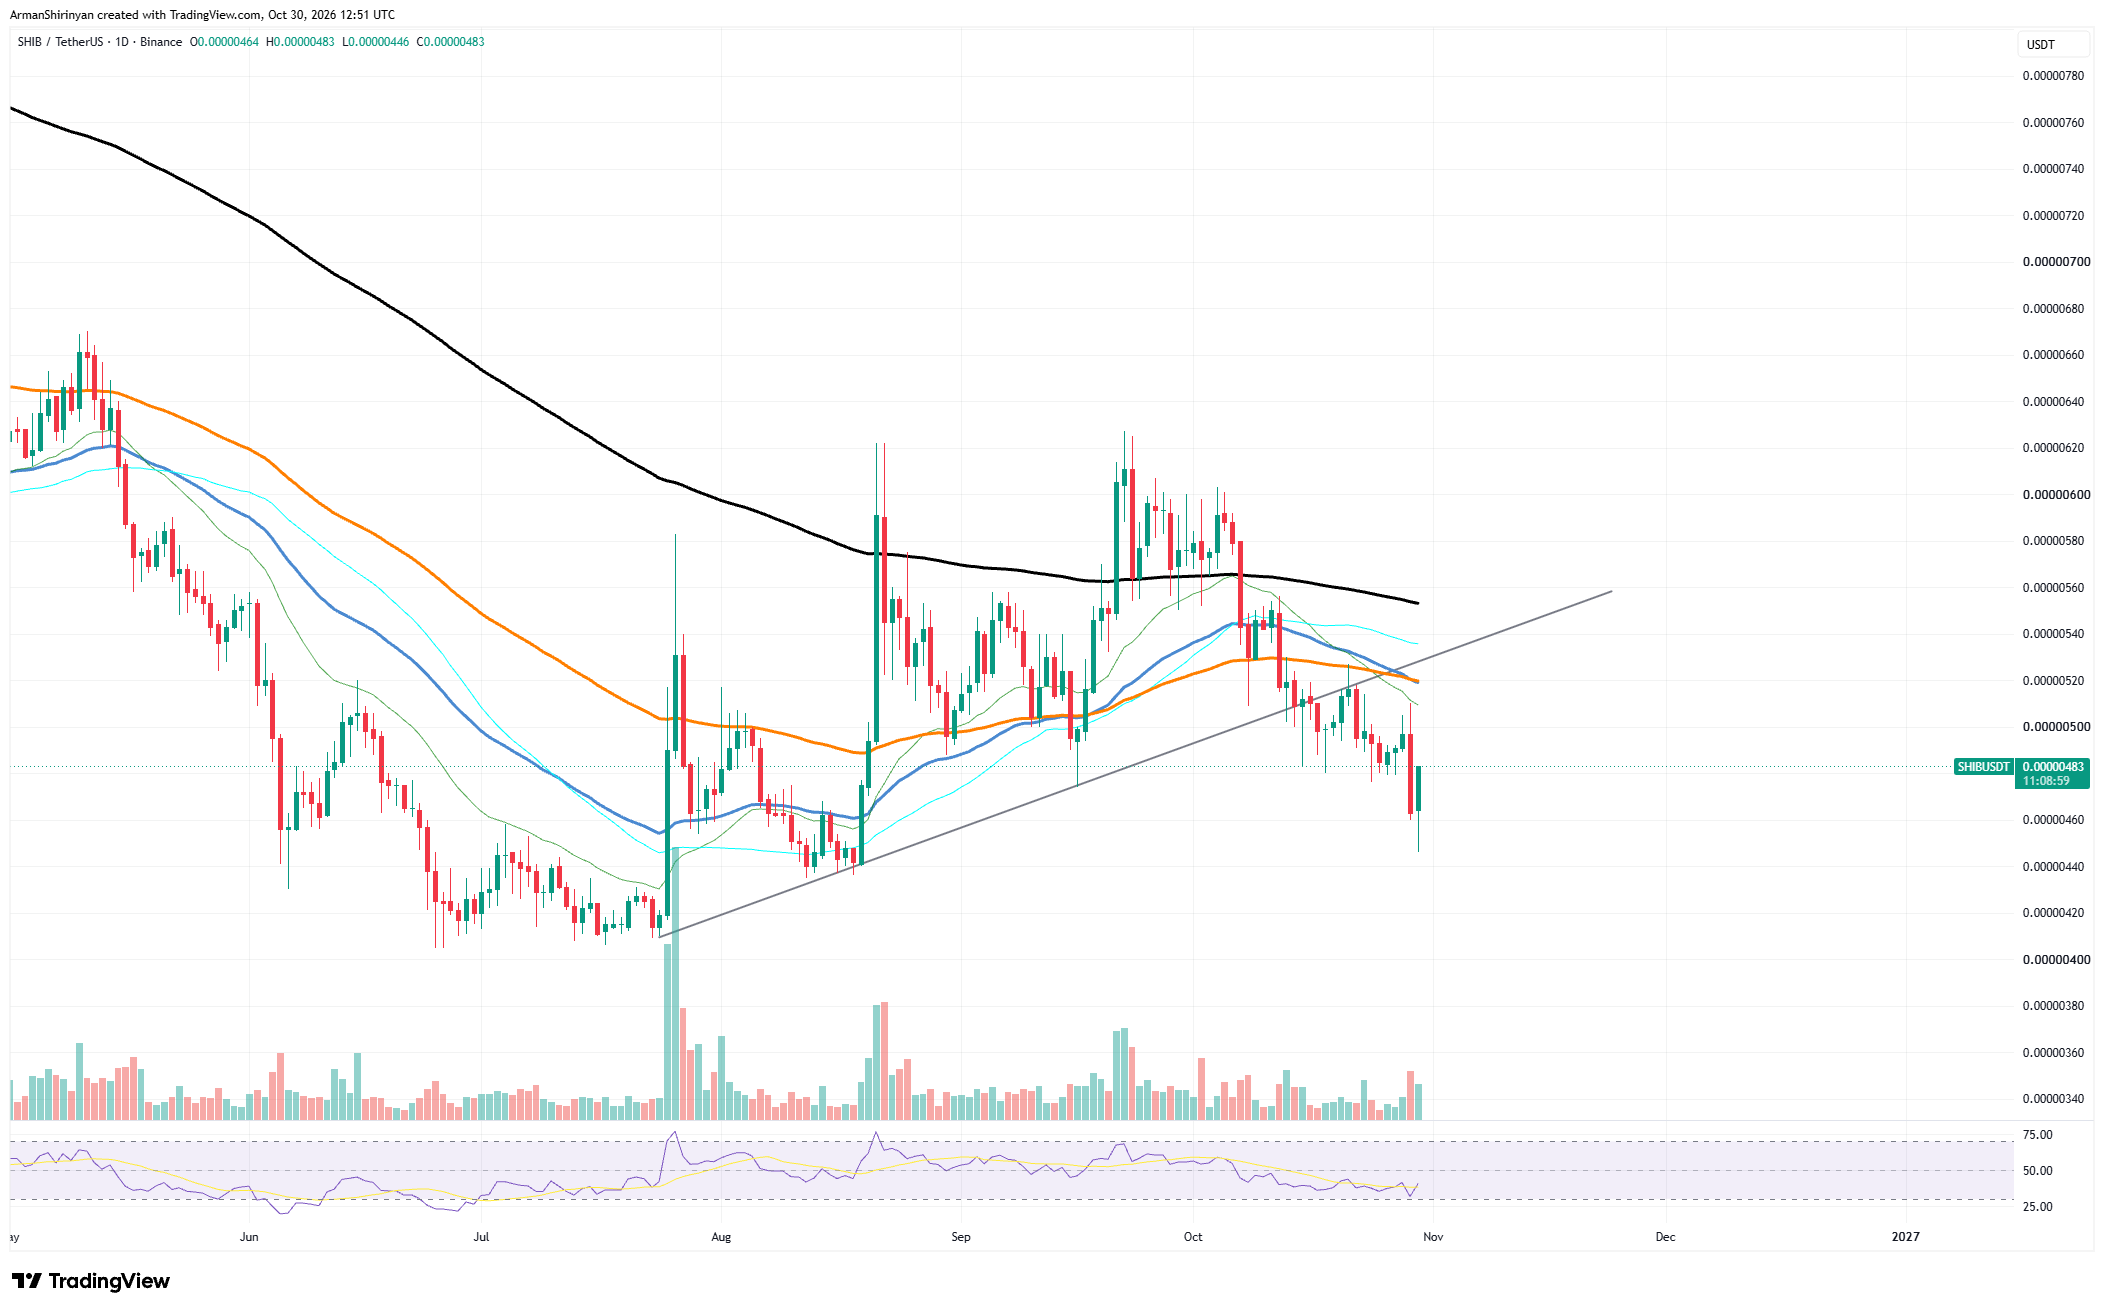
3 Shiba Inu (SHIB) Indicators Paint Worrying Picture: Where Can Its Price Drop?
u.today
31 October 2026 04:50, UTC
Shiba Inu ($SHIB) is showing signs of weakness again, as bearish technical indicators suggest the cryptocurrency could face another sharp decline. Despite several recovery attempts in recent months, $SHIB is still stuck below major resistance levels, and selling pressure continues to dominate its price structure.
Three indicators in particular point to more downside risks.
1. Rising Volume During the Downtrend
One concerning development is the increase in trading volume that comes with $SHIB's recent price declines. The latest daily candlesticks show stronger selling activity as the token approaches the $0.00000460–$0.00000480 support region.
Know when your coins move
Alerts, real-time prices, and market news — all in one app
Point your phone camera to install
4.8 based on 40K reviews in the App Store and Google Play
Rising volume during downward movements usually means stronger seller participation rather than temporary market weakness. Unless buyers absorb this pressure, $SHIB could struggle to defend its current levels.
A clear breakdown below $0.00000460 could expose the cryptocurrency to its previous lows near $0.00000420, followed by the psychologically important $0.00000400 level.
2. RSI Signals Bearish Continuation
The Relative Strength Index (RSI) gives another warning. On the daily chart, the indicator has slipped toward the lower end of its neutral range, which reflects weakening momentum.
Although $SHIB is approaching oversold territory, this does not necessarily mean a recovery is coming soon. During long downtrends, RSI can stay low for a long time while prices keep falling.
A sustained move below the 30 threshold would confirm stronger bearish momentum and increase the likelihood of another downward move.
3. Moving Averages Threaten More Bearish Crossovers
$SHIB's moving-average structure also remains unfavorable. The cryptocurrency trades below several important moving averages, including its longer-term trend indicator.
$SHIB/USDT Chart by TradingView
Shorter-term averages are turning downward, which raises the possibility of more bearish crossovers. Such developments would reinforce the existing downtrend and could discourage buyers from entering the market.
The $0.00000520–$0.00000560 region is now an important resistance zone that $SHIB must reclaim to improve its technical outlook.
With selling volume increasing, RSI weakening, and moving averages staying in a bearish alignment, $SHIB faces substantial downside risks.
The immediate downside targets are $0.00000460 and $0.00000420, with $0.00000400 emerging as a possible deeper support level.
Unless $SHIB reclaims its overhead moving averages and attracts stronger buying volume, the path of least resistance appears to remain downward.

 u.today