BNB Price Analysis: 10.5% Crash Threatens $674 Support After Binance Hack
coinedition.com
30 October 2026 22:26, UTC
Binance Coin dropped 10.51% toward $680 following Binance’s October 29 security breach, then recovered near $701 on Friday. $BNB nevertheless remained 7.77% below its pre-selloff level, placing September support back in focus.
The price analysis identifies $674.60 as the decisive lower boundary after a breakdown on the daily chart. Binance estimated $6.3 billion in affected assets and identified a potentially compromised engineer’s laptop during its preliminary investigation.
However, Binance reported no evidence that wallet private keys were leaked. Binance subsequently reserved more than $6.34 billion to cover losses, including $5 billion held in affected tokens, while approximately $3 billion in affected assets were frozen.
Know when your coins move
Alerts, real-time prices, and market news — all in one app
Point your phone camera to install
4.8 based on 40K reviews in the App Store and Google Play
Metric
Reported Value
Price Decline
10.51%
Friday Recovery
Approximately $701
Pre-Selloff Difference
−7.77%
Binance Hack
$6.3 Billion
Recovery Reserves
Over $6.34 Billion
Frozen Assets
Approximately $3 Billion
$BNB Price Analysis Shows 10.5% Crash Toward September Lows
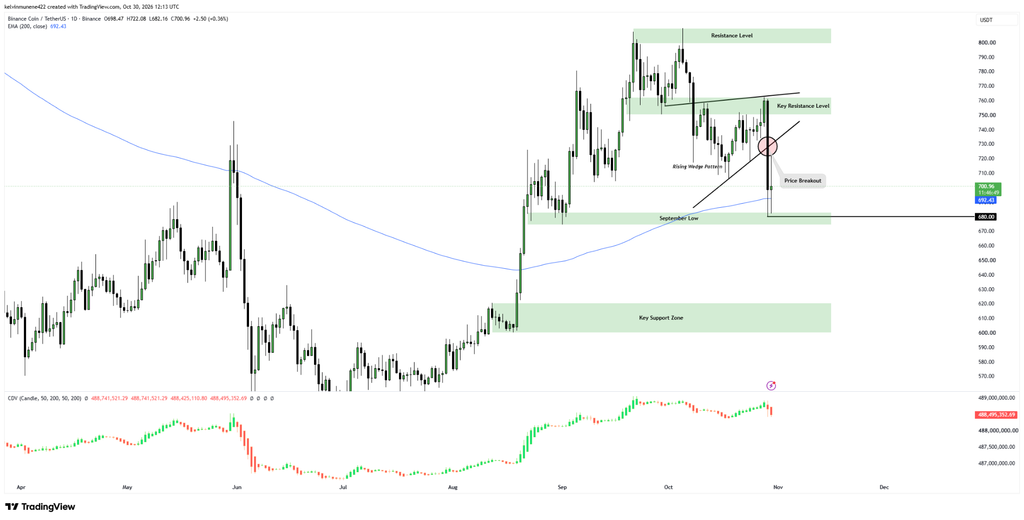
The Binance Coin price analysis shows the token losing ascending trendline support after failing to clear $750.47–$762.20. Selling pressure then pushed $BNB toward the September low area spanning $683 to $674.60.
Despite Binance’s recovery reserves, $BNB remained below the broken trendline support, leaving Friday’s rebound short of an established reversal. Moreover, Binance Coin reclaimed its 200-day exponential moving average at $692.43, although the break below rising support remained intact.
Source: TradingView
As of press time, $BNB’s price analysis places $674.60 below this average as the next critical threshold. A sustained close beneath that level would expose the $620.55–$600 zone. For Binance Coin, the price analysis also identifies $750.47–$762.20 as the first major overhead barrier. A recovery beyond that band would bring $799.41–$809.99 into view.
Follow us onXfor real-time crypto updates.
$BNB Weekly Chart Maps $698.95 Support and $772.56 Resistance
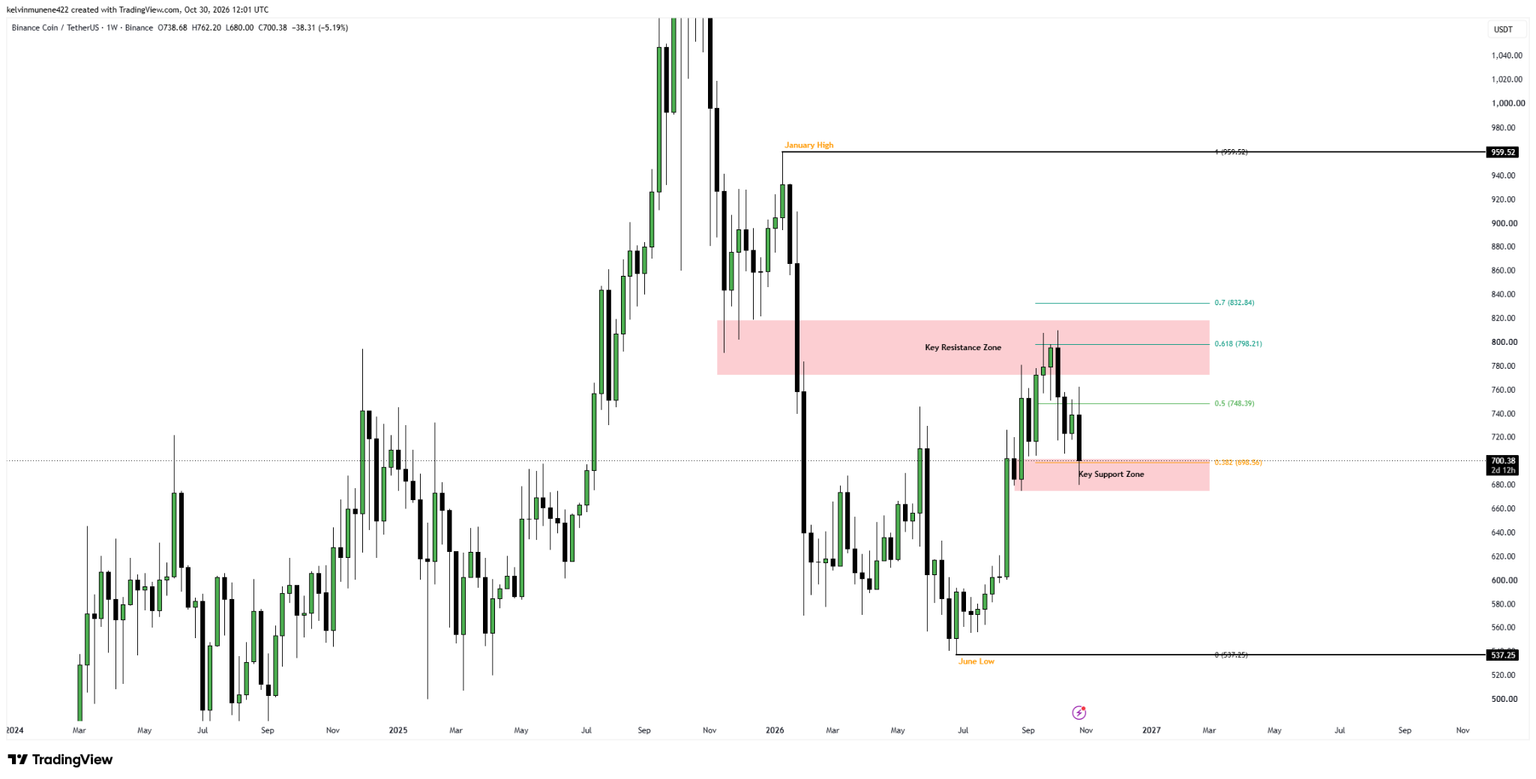
On the weekly chart, Binance Coin remains within a $674.60–$702.37 support band. The $BNB price analysis highlights the 38.2% Fibonacci retracement at $698.95, close to Friday’s quoted value. This overlap places the token near two independently identified support references.
Source: TradingView
On the upside, the Binance Coin price analysis marks $748.39 at the 50% retracement, followed by $798.21 at 61.8%. $BNB also faces weekly resistance extending from $772.56 to $813.39. Therefore, a weekly close below $674.60 would weaken support, while reclaiming $772.56 would mark a stronger rebound.
As Binance continues security checks and asset recovery efforts, $BNB remains near its lower weekly boundary. Consequently, market participants are monitoring whether buyers can defend this support and establish a stronger recovery.
Key $BNB Technical Levels
Price Level
Technical Significance
$799.41–$809.99
Higher Resistance
$772.56
Weekly Recovery Threshold
$748.39
50% Fibonacci Retracement
$698.95
38.2% Fibonacci Support
$692.43
200-Day EMA
$674.60
Critical Support
$620.55–$600
Lower Support Zone
Bullish Case
Holding $674.60 and reclaiming $748.39 would strengthen recovery prospects, placing $772.56 and $798.21 in focus.
Bearish Case
A sustained close below $674.60 would weaken September support and expose the $620.55–$600 zone.
FAQs
1. Why Did $BNB Fall 10.51%?
The decline followed Binance’s October 29 security breach involving approximately $6.3 billion in assets.
2. What Is $BNB’s Critical Support Level?
The September low at $674.60–$683 represents the critical downside threshold.
3. What Happens If $BNB Loses $674 Support?
A sustained breakdown would expose the $620.55–$600 support zone.
4. What Resistance Must $BNB Reclaim?
The weekly chart identifies $748.39, $772.56, and $798.21 as recovery thresholds.
Subscribe to our YouTube channel for the latest crypto news.
Related: Bitcoin Price Analysis: BTC Order Book Shows Discount Bids Before Choppy Close

 coinedition.com