Bless ($BLESS) has gained significant market attention after extending its rally over the past week. The token has climbed 59.33% in seven days, while its latest 24-hour gain reached 31.76%. $BLESS now trades around $0.01285, with daily trading volume exceeding $12.67 million. The rally has also pushed its market capitalization to approximately $23.66 million.
$BLESS Breakout Places $0.01281 Resistance in Focus
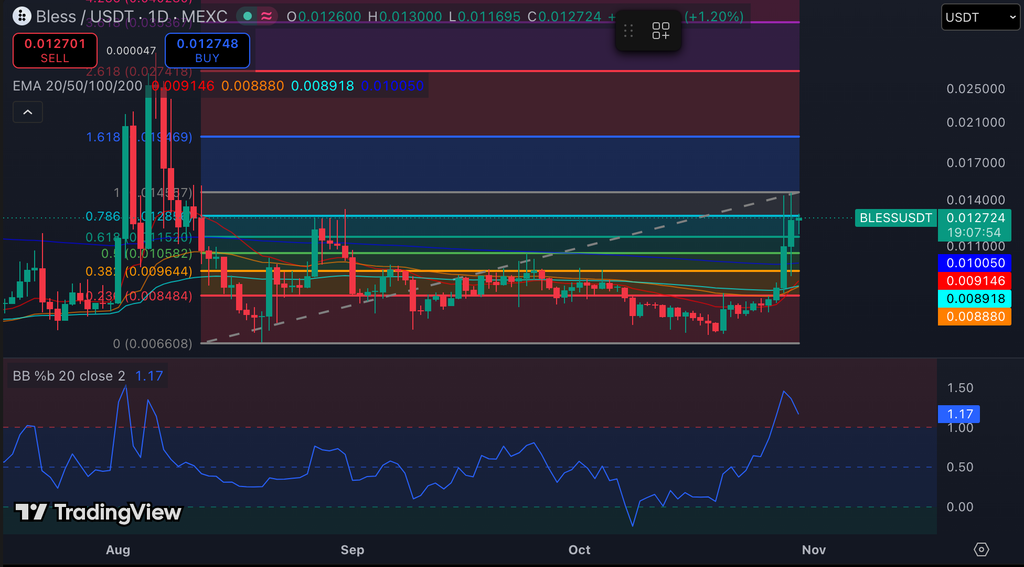
$BLESS has broken above its major daily exponential moving averages (EMAs), strengthening its bullish technical outlook. The price now trades above the 20, 50, 100, and 200-day EMAs. This development suggests buyers have regained control after an extended consolidation period.
However, the token faces immediate resistance around $0.01281. This level aligns with the 0.786 Fibonacci retracement and represents an important breakout barrier. A sustained move above this zone could encourage additional buying activity.
Know when your coins move
Alerts, real-time prices, and market news — all in one app
Point your phone camera to install
4.8 based on 40K reviews in the App Store and Google Play
$BLESS Price Dynamics (Source: TradingView)
Significantly, the next major upside target stands near $0.01459. This level corresponds with the previous swing high and the 1.0 Fibonacci retracement. A successful breakout could therefore give $BLESS another opportunity to extend its recovery.
On the downside, $0.01154 provides the first important support level. The 200-day EMA near $0.01005 offers another reference point if selling pressure increases. Hence, maintaining these levels remains important for preserving the current bullish structure.
Meanwhile, the Bollinger Bands %B indicator has climbed to 1.17. This reading places $BLESS above its upper Bollinger Band. Although this reflects strong buying pressure, it also suggests an overstretched rally. Consequently, short-term profit-taking could interrupt the upward movement.
Rising Open Interest Signals Renewed Trader Participation
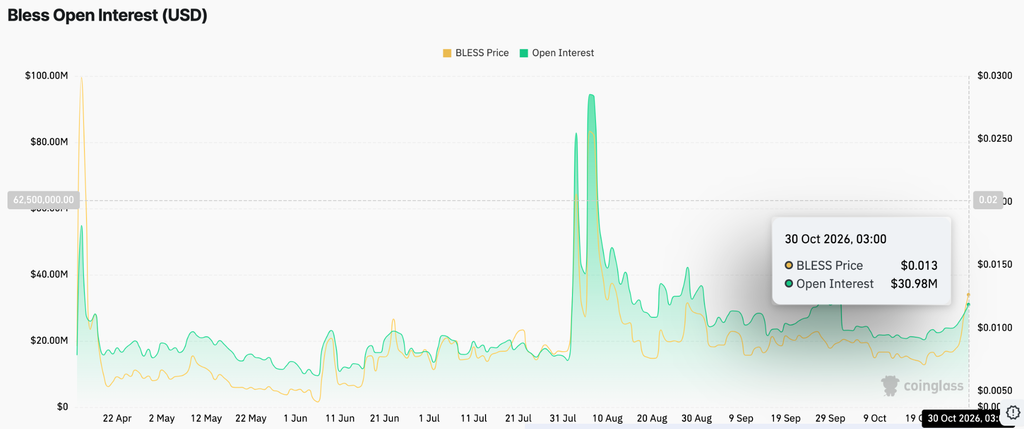
Derivatives activity provides another perspective on $BLESS’s recent price performance. Open interest remained relatively steady between $15 million and $22 million throughout May and July.
Source: Coinglass
However, activity accelerated sharply in early August. Open interest briefly approached $94 million as traders increased their exposure. The subsequent decline toward $30 million indicated widespread position closures.
Throughout September and October, open interest mostly fluctuated between $20 million and $35 million. Recent figures show another increase, reaching approximately $30.98 million.
Positive Spot Flows Support the Recovery
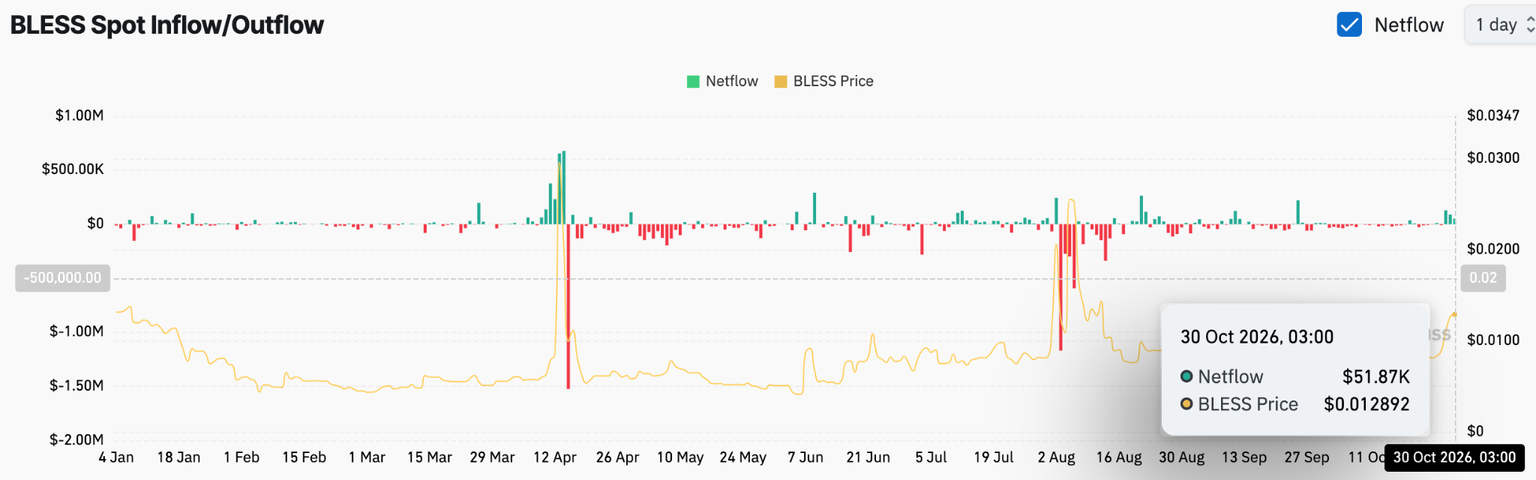
Spot market activity also shows signs of improving conditions. $BLESS experienced considerable inflow and outflow fluctuations throughout the year.
Source: Coinglass
April recorded inflows exceeding $600,000 before outflows surpassed $1.5 million. Selling pressure continued into May, while June and July showed relatively calmer activity.
August introduced another period of volatility, with outflows exceeding $1 million. September and October subsequently displayed more balanced trading activity.
Moreover, the latest figures recorded positive netflows of $51,870 on October 30. $BLESS traded around $0.012892 during this period. This development suggests renewed buying interest, although sustained accumulation remains unconfirmed.
Technical Outlook for Bless ($BLESS) Price
Key levels remain well-defined as $BLESS maintains its bullish breakout:
Upside levels: $0.01281 represents immediate resistance. A breakout could push $BLESS toward $0.01459, its next major resistance and previous swing high.
Downside levels: $0.01154 serves as initial support, followed by the $0.01005 level near the 200-day EMA.
Resistance ceiling: $0.01281 (0.786 Fibonacci level) remains the immediate barrier. Clearing this level could strengthen medium-term bullish momentum.
Momentum indicator: Bollinger Bands %B stands at 1.17, indicating overbought conditions and increased short-term correction risks.
Will $BLESS Go Up?
$BLESS price prediction hinges on whether buyers can sustain momentum above $0.01154 and overcome resistance at $0.01281. The recent 59.33% weekly gain, rising open interest, and positive spot netflows support the bullish outlook. If buying pressure continues, $BLESS could advance toward $0.01459.
However, failure to maintain support could trigger profit-taking toward $0.01005. For now, $BLESS retains a bullish structure, but sustained inflows and a confirmed resistance breakout will determine its next move.

 coinedition.com