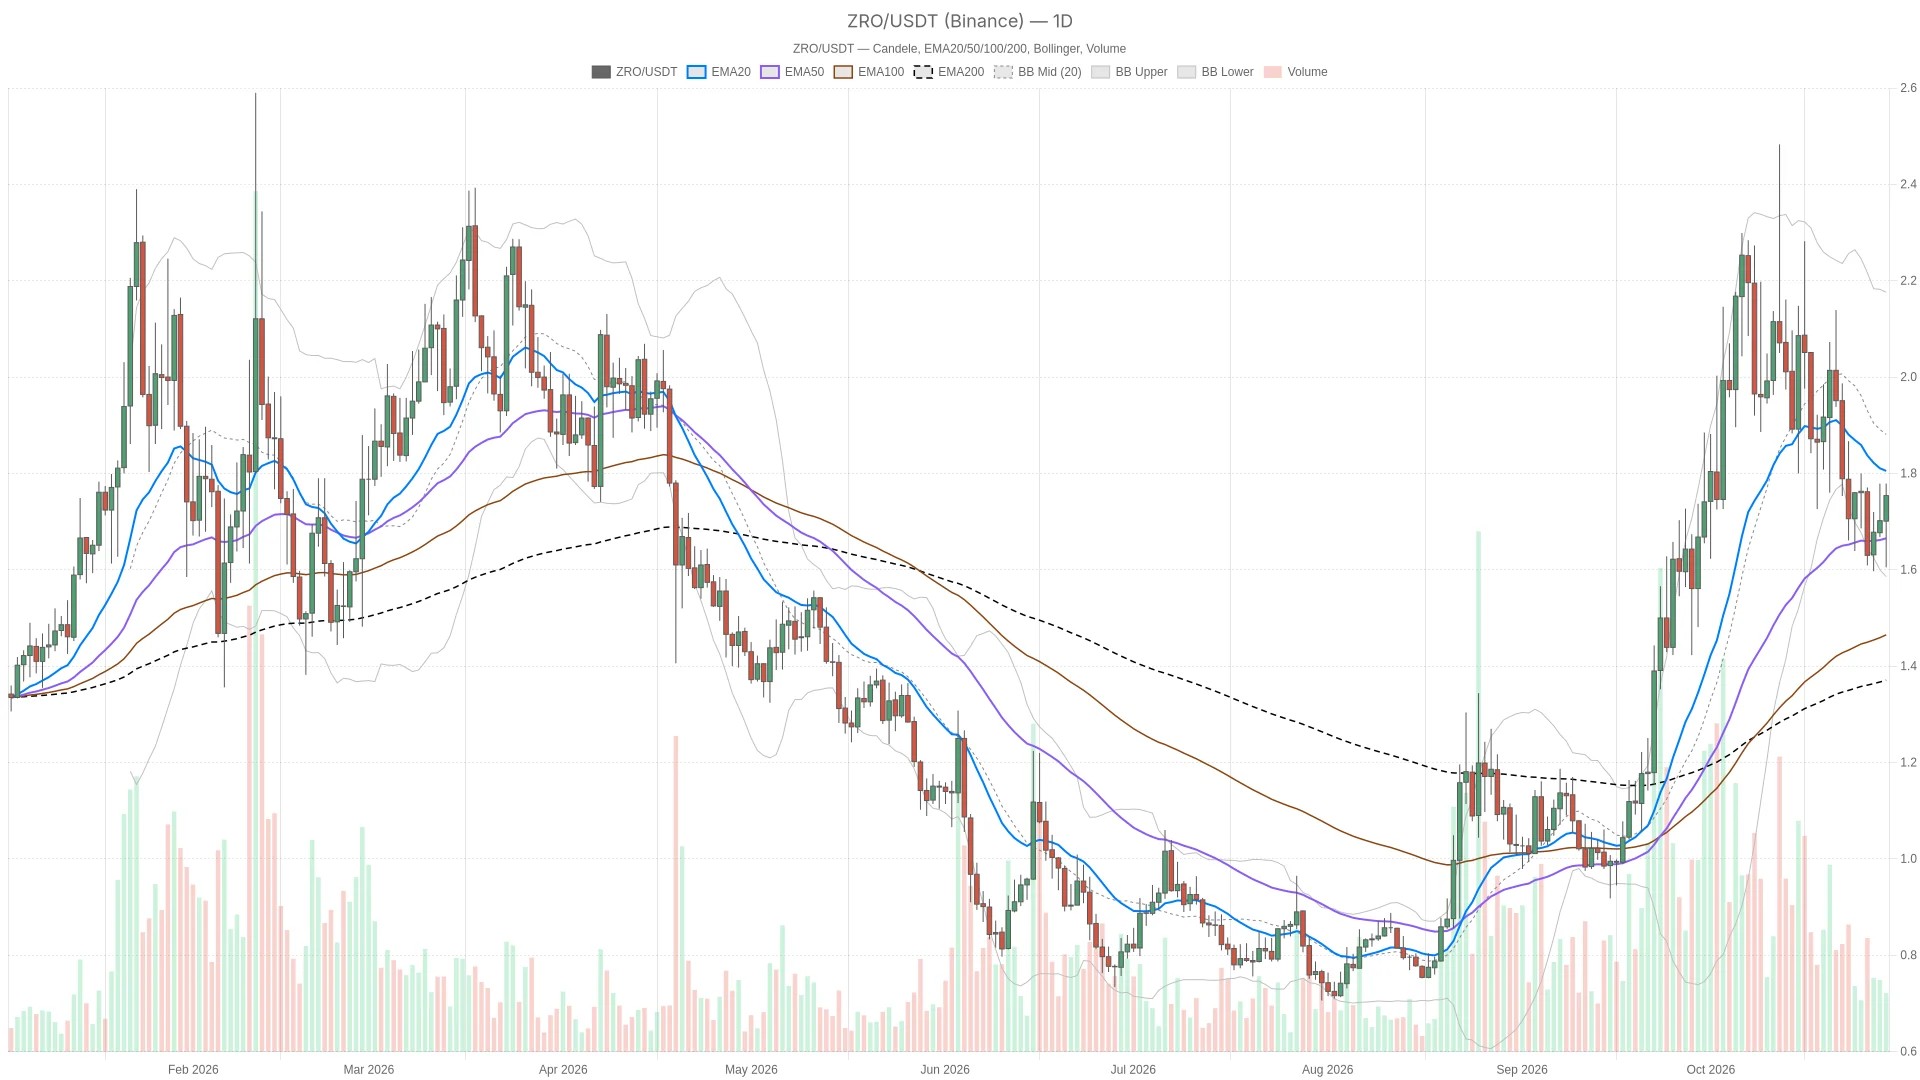
The central tension is between live price strength and completed-candle evidence. Price is above all three hourly moving averages, but those averages remain bearishly ordered. The recovery is moving faster than the underlying structure can confirm, leaving a failed breakout as the immediate risk.
LayerZero price faces a daily R1 test at $1.76
The recovery’s first real test is a daily close above $1.76, the level separating a genuine breakout from an intraday overshoot.
Bullish scenario: a daily close above daily R1 at $1.76 would confirm a break of the nearest daily resistance and put the daily EMA20 at $1.81 in focus. A subsequent daily close below the daily pivot at $1.72 would invalidate that breakout scenario. Until the candle completes, a move through resistance remains an intraday test rather than confirmation.
Bearish scenario: the trigger—a daily close below the daily pivot at $1.72—was already satisfied by the last completed daily candle at $1.70. The live recovery above that pivot now challenges the bearish reading; it is not a fresh breakdown waiting to happen. A daily close above daily R1 at $1.76 would invalidate this scenario. If the recovery fails, the next daily supports are the daily EMA50 at $1.66 and daily S1 at $1.65.
For execution context, the hourly Bollinger upper band at $1.75 is the nearest support below the unrounded hourly live price, followed by the hourly EMA200 at $1.74. These are distinct hourly references, not substitutes for daily confirmation. The likeliest false signal is a brief push above daily R1 that fails to hold into the daily close: short-term strength would then have outrun the broader recovery.
RSI favors short-term strength, while daily MACD remains negative
Momentum indicators show short-term strength without yet confirming a completed trend change.
Daily RSI is rising at 45.5, while hourly RSI stands at 47.5 with no consistent direction across its latest completed readings. The 15-minute RSI is rising at 67.5, approaching but not reaching overbought territory. Momentum is therefore strongest at the execution timeframe; the daily and hourly readings do not yet show the same conviction.
The daily MACD histogram remains negative but is narrowing, and the hourly histogram is also negative and narrowing toward zero. That supports an easing of bearish momentum, not a completed bullish handover. The 15-minute histogram is positive, but its supplied trend is flat. Together, these readings support a rebound while stopping short of confirming that the daily correction is over.
Bullish daily EMA ordering contrasts with bearish intraday structure
The moving-average picture is split: daily averages support a bullish structure, while intraday averages have not yet realigned.
The daily averages are bullishly ordered, but live price is below the daily EMA20 at $1.81, above the daily EMA50 at $1.66 and above the daily EMA200 at $1.37. In practice, the broader moving-average structure is constructive while the immediate daily trend remains under pressure.
On the hourly chart, price is above the EMA20 at $1.66, EMA50 at $1.68 and EMA200 at $1.74, despite their bearish ordering. The 15-minute chart has the same structural conflict: price is above its EMA20 and EMA50, both displayed at $1.65 after rounding, and above its EMA200 at $1.68, while the averages remain bearishly ordered. Price has reclaimed those references; the averages themselves have not realigned.
The daily Bollinger midpoint is $1.89, with the lower band at $1.60 and upper band at $2.18. Trading below the midpoint keeps the recovery in the lower half of the daily envelope. Meanwhile, the hourly live price is just above its upper band, and the 15-minute live price is above its upper band at $1.69. That is evidence of short-term extension, not proof of a lasting breakout.
Daily ATR is $0.1964, compared with $0.03338 hourly and $0.01811 on the 15-minute chart. These Binance-based readings put the narrow gap between nearby levels in perspective: a resistance crossing can occur within ordinary price movement, making the completed close more meaningful than the initial touch.
Neutral sentiment offers no decisive risk-appetite signal
Broader market sentiment sits at neutral, offering neither a tailwind nor a headwind for $ZRO’s recovery.
Alternative.me’s Fear & Greed Index is classified as Neutral. CoinGecko places total cryptocurrency market capitalization at $2.70 trillion and Bitcoin dominance at 59.39%. This backdrop does not supply a clear sentiment extreme to reinforce either $ZRO scenario; the asset’s own confirmation levels remain the more direct evidence.
FAQ
Has $ZRO confirmed a bullish daily reversal?
No. The live recovery has not met the bullish scenario’s requirement for a daily close above daily R1 at $1.76.
Do the intraday averages confirm the rebound?
Only partially. Price is above the hourly and 15-minute moving averages, but both sets remain bearishly ordered.
Disclaimer: This article is for informational purposes only and does not constitute financial advice, an investment recommendation, or a solicitation to buy or sell any financial instrument or cryptocurrency. The analysis provided is not indicative of future results. Investing in crypto assets and financial markets carries a high risk of capital loss. Always do your own research (DYOR) and consult a qualified financial advisor before making any decision.
Article produced with the assistance of artificial intelligence and reviewed by the editorial team.

 en.cryptonomist.ch