STAR50 represents large, liquid securities on the technology board. Its decline measures equity repricing, rather than the performance of China's entire AI industry.
CryptoSlate compared that endpoint loss with every overlapping 71-session return in Yahoo Finance's US index histories through Oct. 26:
The loss sits deep in the downside tail even against chip stocks, an additional technology-sector comparison. But overlapping windows share observations and cluster around crises. These frequencies describe the historical sample; they are not independent crash probabilities.
The calculation compares starting and ending closes over equal trading-session intervals. It does not compare the deepest fall inside each window or equate a four-month move with a full, multiyear bear market.
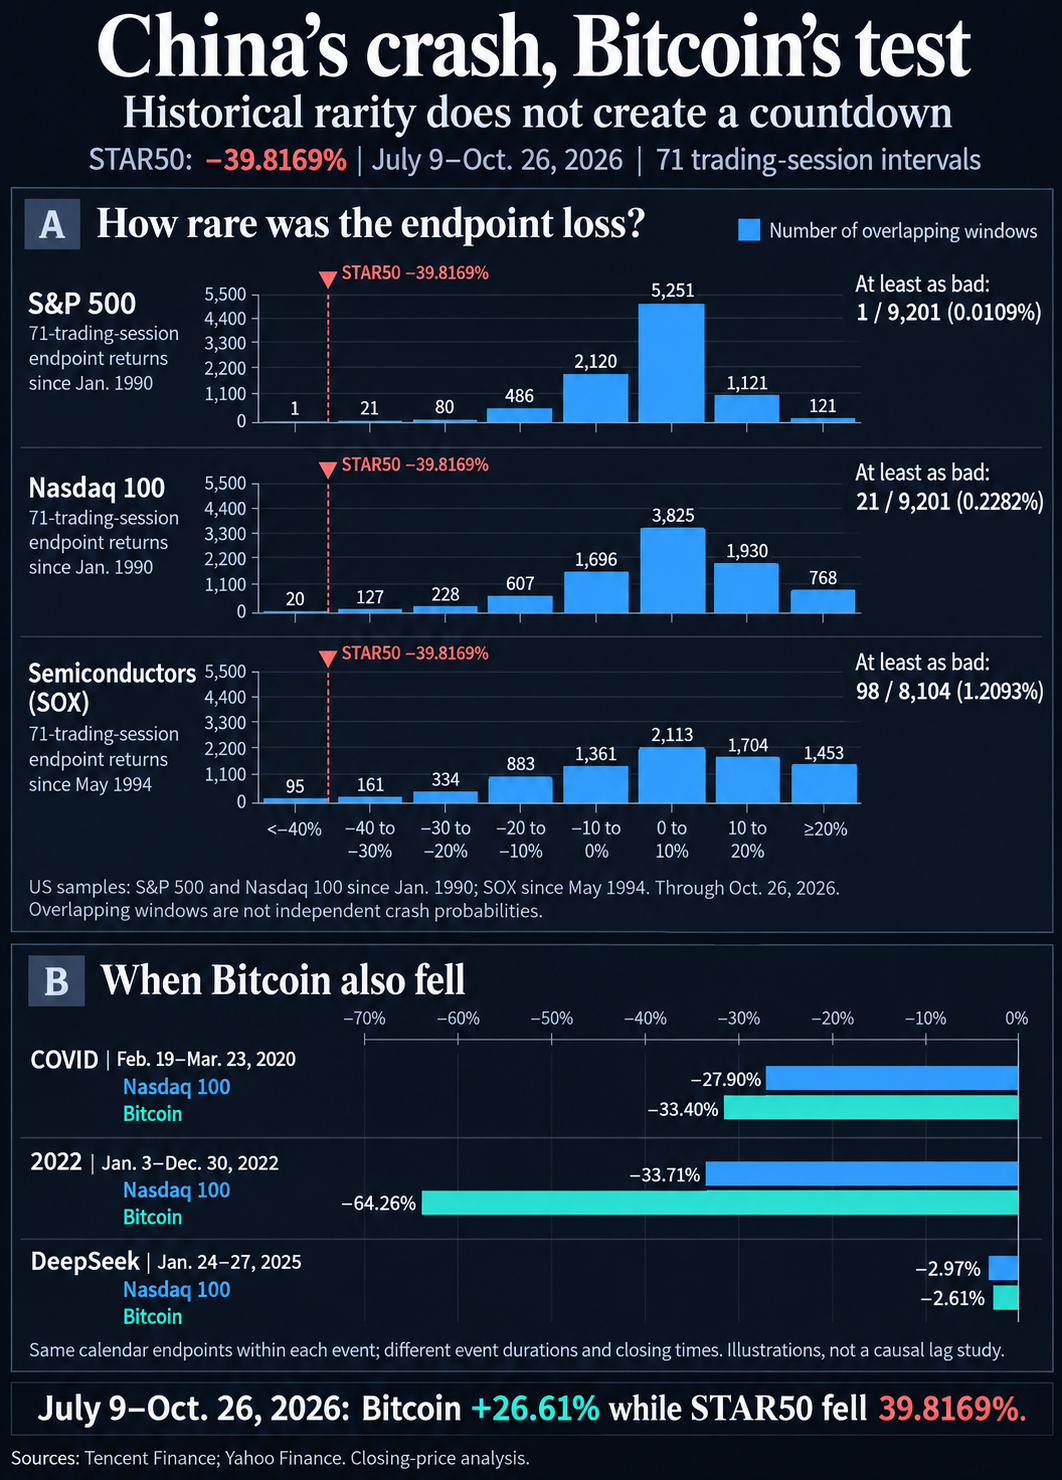
Bitcoin has also joined broader market selloffs, as three selected episodes illustrate.
During the selected COVID window from Feb. 19 to March 23, 2020, Nasdaq 100 fell 27.9% and Bitcoin lost 33.4%.
From Jan. 3 to Dec. 30, 2022, their losses were 33.7% and 64.3%, respectively. That period combined Federal Reserve tightening with crypto-specific FTX stress, making it unsuitable for isolating the effect of technology stocks on Bitcoin.
The DeepSeek episode offers a shorter illustration. Between Jan. 24 and Jan. 27, 2025, Nasdaq 100 lost 3%, semiconductors fell 9.2%, and Bitcoin declined 2.6%. Reuters' roughly 6% intraday Bitcoin drop that Monday used a different observation time from the daily-close comparison.
Each pair uses matching calendar endpoints, while the three episodes cover different durations. US equities close in New York and Bitcoin's daily bars end on UTC dates, so these comparisons cannot establish precise intraday reaction times.
How selling could spread to Bitcoin
The current comparison shows different exposures moving differently. From July 9 through Oct. 26, CSI 300 fell 15.9%, Nasdaq 100 lost 1.5%, and US semiconductors declined 14.5%, alongside Bitcoin's gain. Within that window, the largest closing peak-to-trough declines were 7.6% for Bitcoin and 8.8% for Nasdaq 100.
Different cumulative returns do not eliminate short-term links. Bitcoin and Nasdaq 100 had a daily-log-return correlation of about 0.63 over 30 matched US market dates ending Oct. 26, compared with 0.36 ending July 9. The positive reading describes day-to-day co-movement within that sample.
The IMF describes how margin calls, crowded positions and investor withdrawals can force leveraged funds to unwind holdings across markets. Applied to Bitcoin, a wider scramble for cash could overwhelm asset-specific demand.
The dated dashboard gives mixed signals. Farside recorded net US spot Bitcoin ETF outflows of USD 636 million on Oct. 22. It recorded net inflows of USD 110 million on Oct. 26.
US high-yield credit spreads eased from 3.4% on Oct. 22 to 3.3% on Oct. 26, while the broad dollar index was nearly flat over its latest available Oct. 19–23 readings. On Oct. 26, secured overnight financing, or SOFR, was 3.93%, three basis points above the Fed's 3.9% reserve-balance rate. The rate comparison separates a market borrowing rate from an administered policy rate; it covers only one part of dollar funding.
Sustained US technology losses accompanied by wider credit spreads, rising funding pressure and persistent ETF withdrawals would strengthen the contagion case. Orderly financing and renewed ETF buying despite further Chinese losses would weaken it.

 cryptoslate.com