en
Back to the list

92 Billion Shiba Inu (SHIB) in 24 Hours: Reasons Behind the Drop Are Clear Now

source-logo  u.today 29 October 2026 21:42, UTC
image

Shiba Inu ($SHIB) selling pressure keeps on rising as exchange activity is certainly reflecting an uncertainty among traders and investors. Recent on-chain data shows that about 92.07 billion $SHIB tokens flowed into cryptocurrency exchanges on a net basis, raising concerns about further downside as the meme coin struggles to regain bullish momentum.

92 Billion $SHIB Signals Growing Selling Pressure

According to CryptoQuant data, Shiba Inu's exchange netflow reached 92.0678 billion $SHIB, rising 0.77% over the last 24 hours. Positive netflow shows that more tokens entered exchanges than left them, potentially increasing the supply available for selling.

Exchange inflows totaled 324.281 billion $SHIB, representing a 1% increase, while outflows reached 232.2131 billion $SHIB, rising 1.13%. The difference leaves about 92 billion tokens in net deposits, suggesting that traders may be positioning themselves to liquidate holdings or respond to continued market volatility.

Know when your
coins move

Alerts, real-time prices, and market news — all in one app
qr-code Point your phone camera to install
4.8 based on 40K reviews in the App Store and Google Play
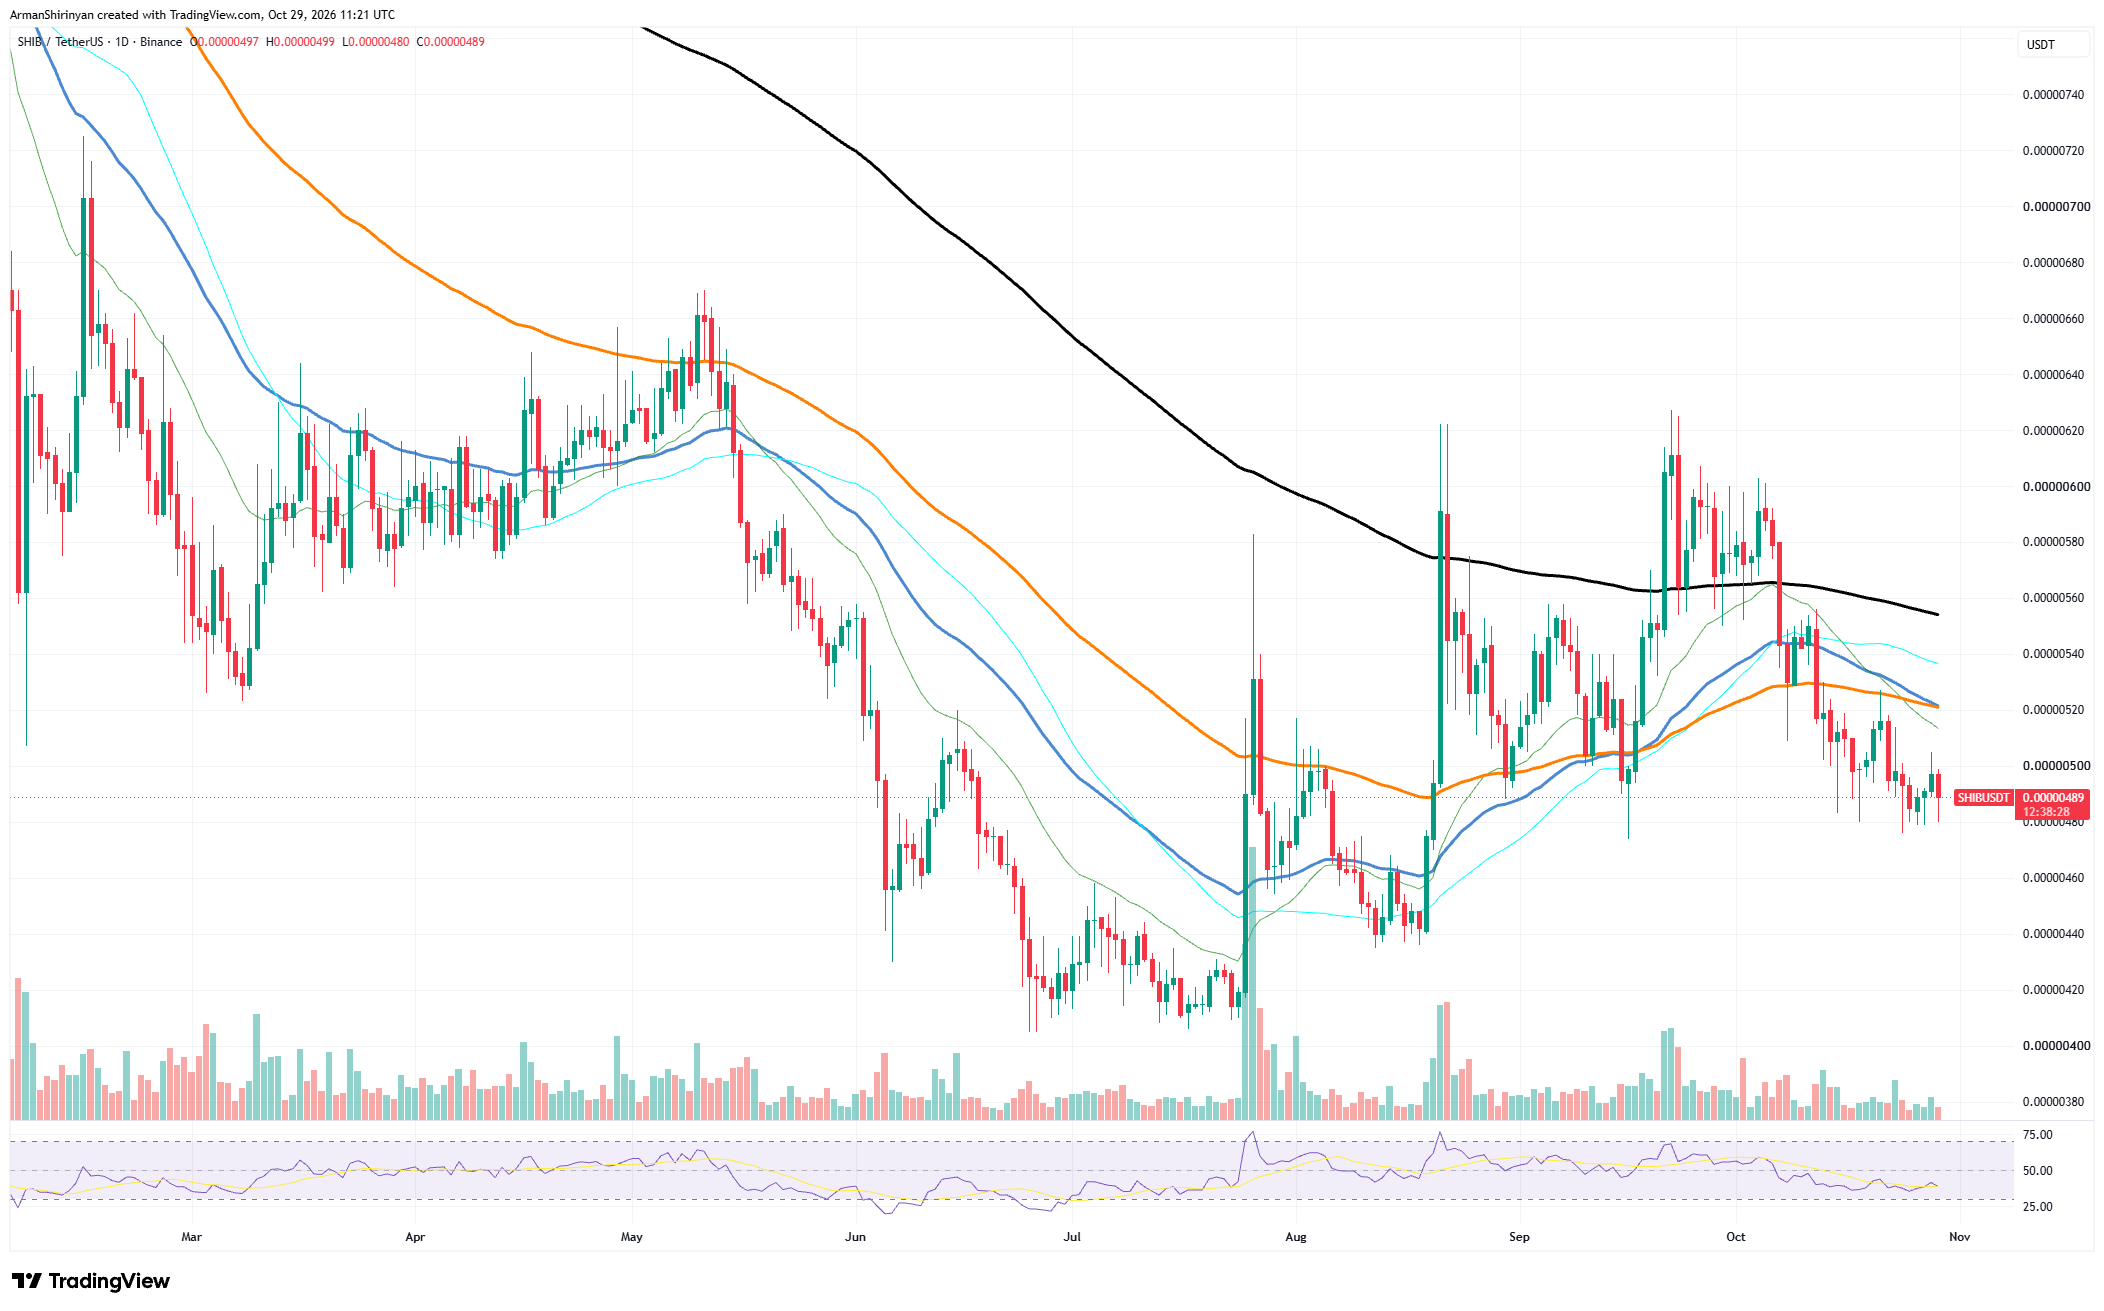
$SHIB/USDT Chart by TradingView

Meanwhile, exchange reserves stood at 86.2525 trillion $SHIB, up 0.11% over the same period. The dollar-denominated value of these reserves declined 2.9% to about $418.32 million, reflecting weakening market valuations despite the increase in token balances.

The current readings showed similar exchange activity earlier in October. On October 23, $SHIB recorded about 77.3 billion tokens in net exchange inflows, indicating that selling pressure has remained a recurring concern.

Shiba Inu Price Struggles Below Key Resistance

Technical signals support the cautious outlook. According to the TradingView daily chart, $SHIB traded around $0.00000489, closing below several major moving averages following its unsuccessful recovery attempt earlier in October. The token previously approached the $0.0000060 area before encountering resistance and reversing lower.

Its inability to hold gains above $0.0000052 has left sellers controlling the short-term trend. The immediate psychological resistance stands near $0.0000050, followed by stronger resistance between $0.0000054 and $0.0000056. On the downside, support appears near $0.0000048, with a deeper decline potentially exposing the $0.0000044 area.

The Relative Strength Index (RSI) also remains below the neutral 50 level, suggesting weak buying momentum.

u.today